Product Insights brings to light both high level and granular views of how your products are performing. With this powerful tool, you’ll gain visibility into product performance, how shoppers interact with your products, and suggested action steps to further optimize performance. This reporting can be viewed up to two years back from the current date.
Top Products
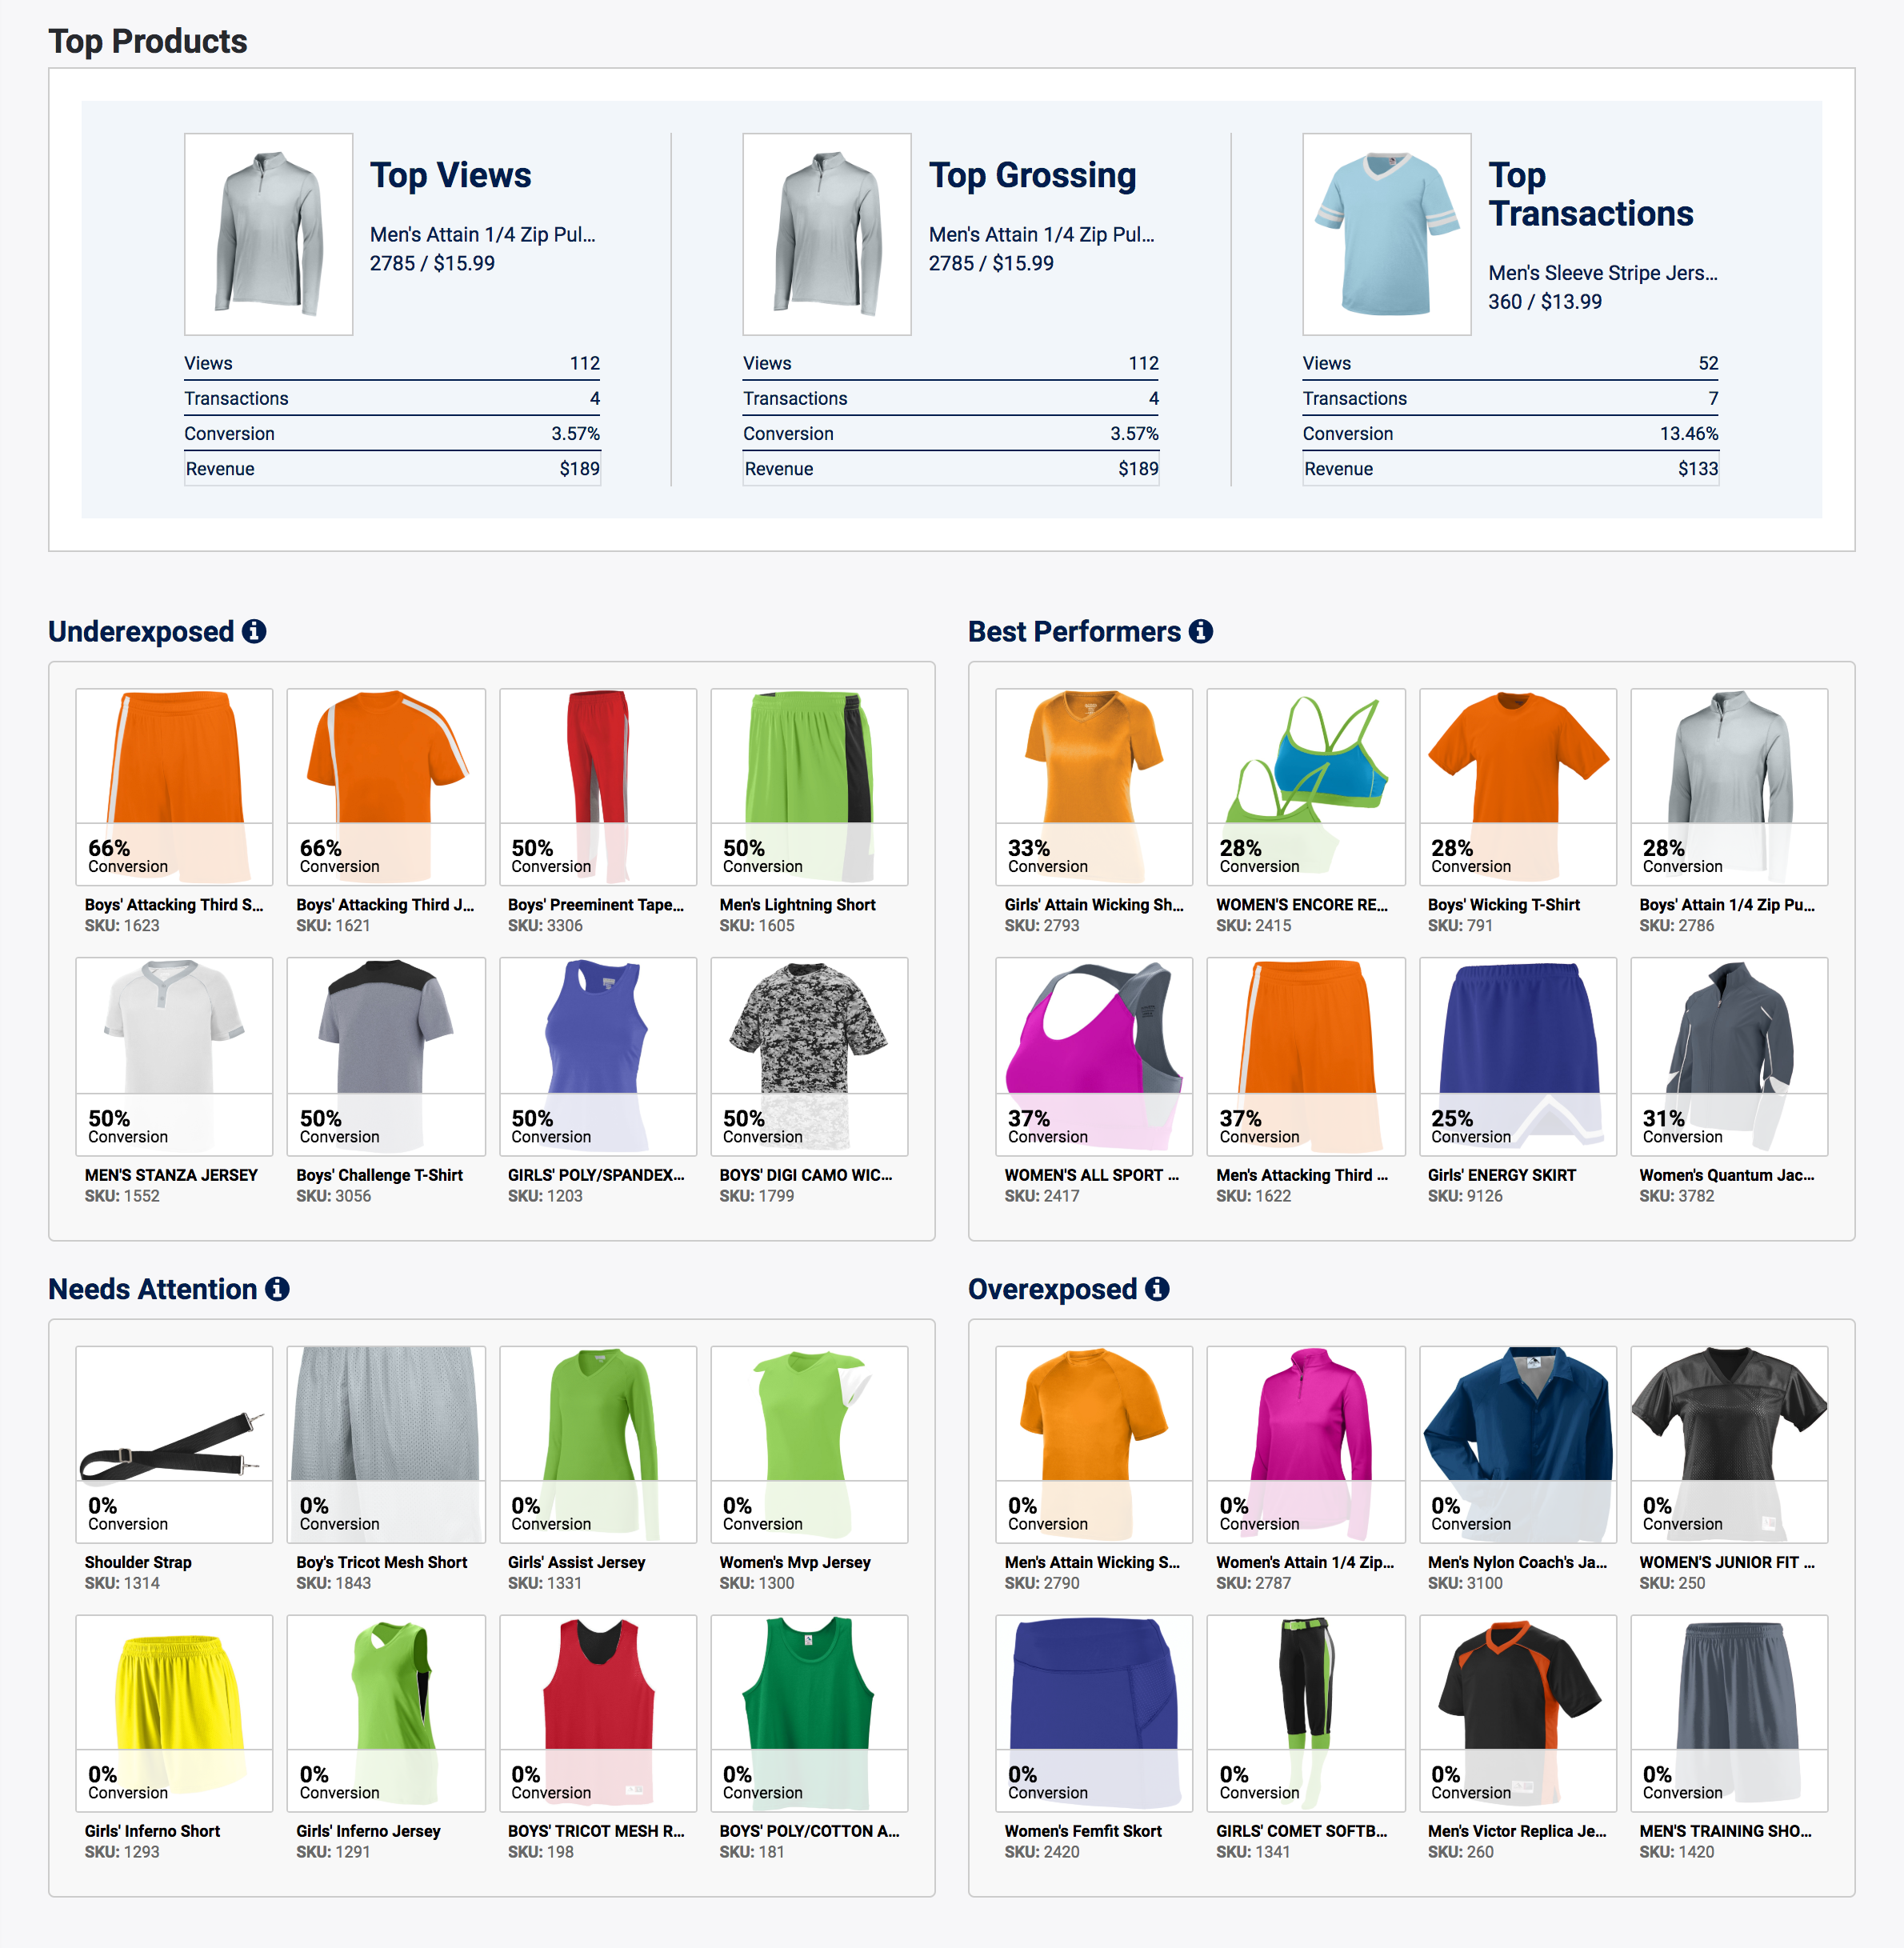
At the top of the overview page, there are highlights showing the top Viewed, Grossing, and number of Transactions product for the selected timeframe.
Top Views
The product with the most views (in your currently selected date range) is highlighted at the top, as well as some other metrics such as Transactions and Conversion to easily compare it to your other top performers in this section.
Top Grossing
The product with the highest revenue generation (in your currently selected date range) is highlighted here.
Top Transactions
The product involved in the highest number of transactions (in your currently selected date range) is highlighted here.
Performance Quadrants
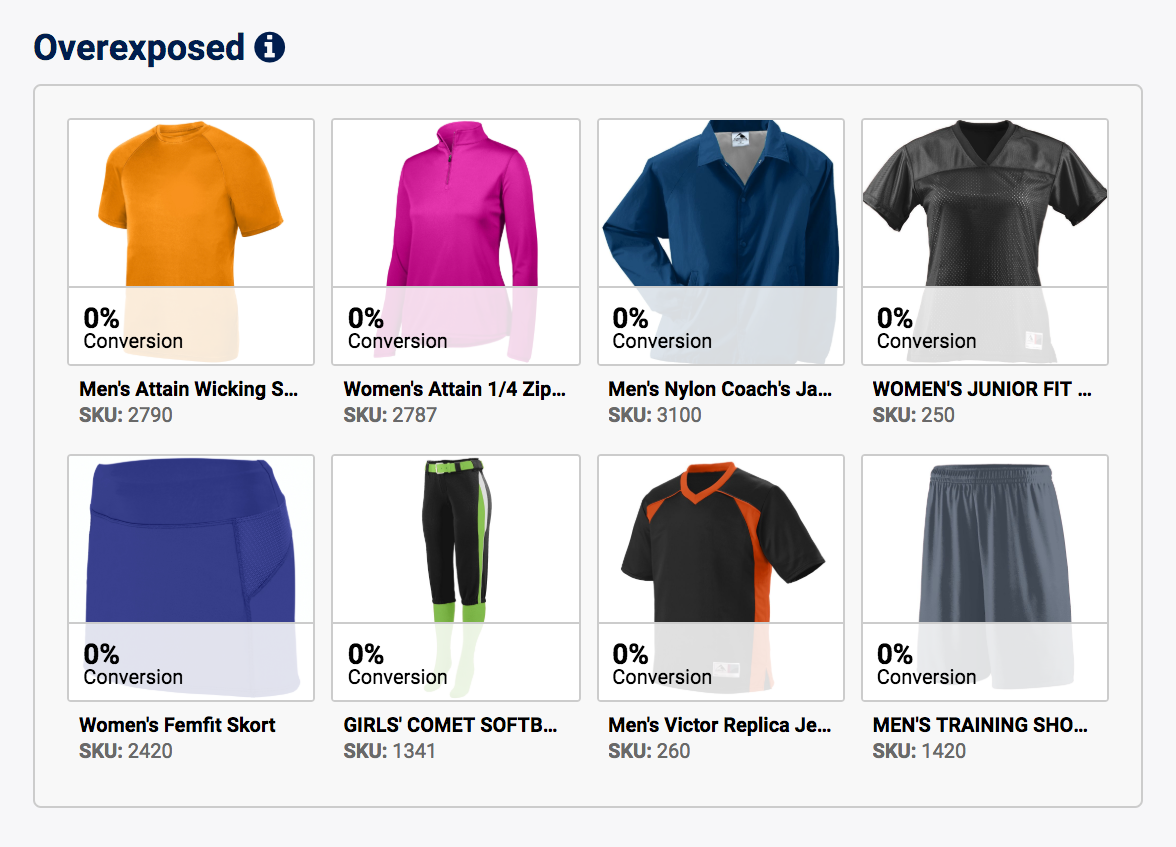
Below the highlights are the Performance Quadrants, which is a breakdown unique to Searchspring that shows groups of products that are Underexposed, Overexposed, and Best Performers, with suggested action steps for each group. Is a product overexposed? Try checking for product page issues, or lower the price.
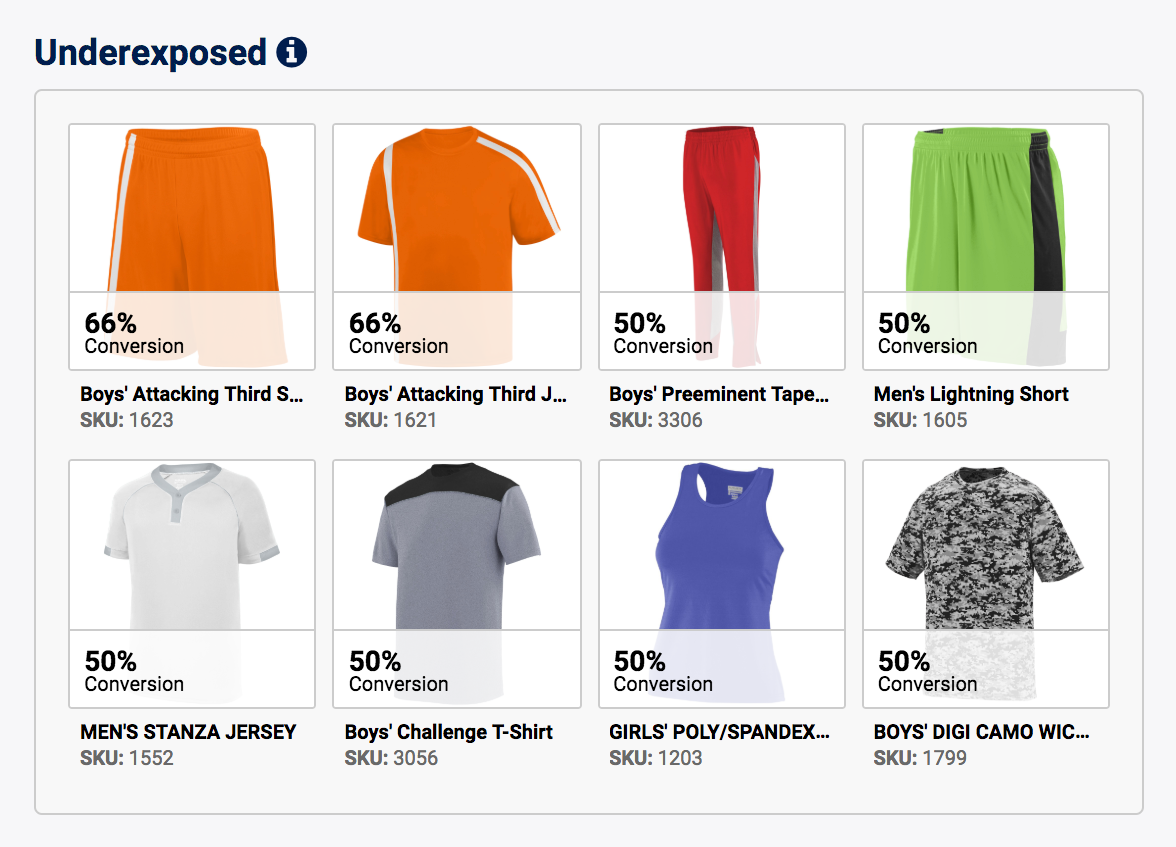
Quadrant: Underexposed
High conversion rate, but low exposure. Not many people see this product, but those who do purchase it consistently.
Suggested Action - Merchandise: Increase exposure by promoting the product
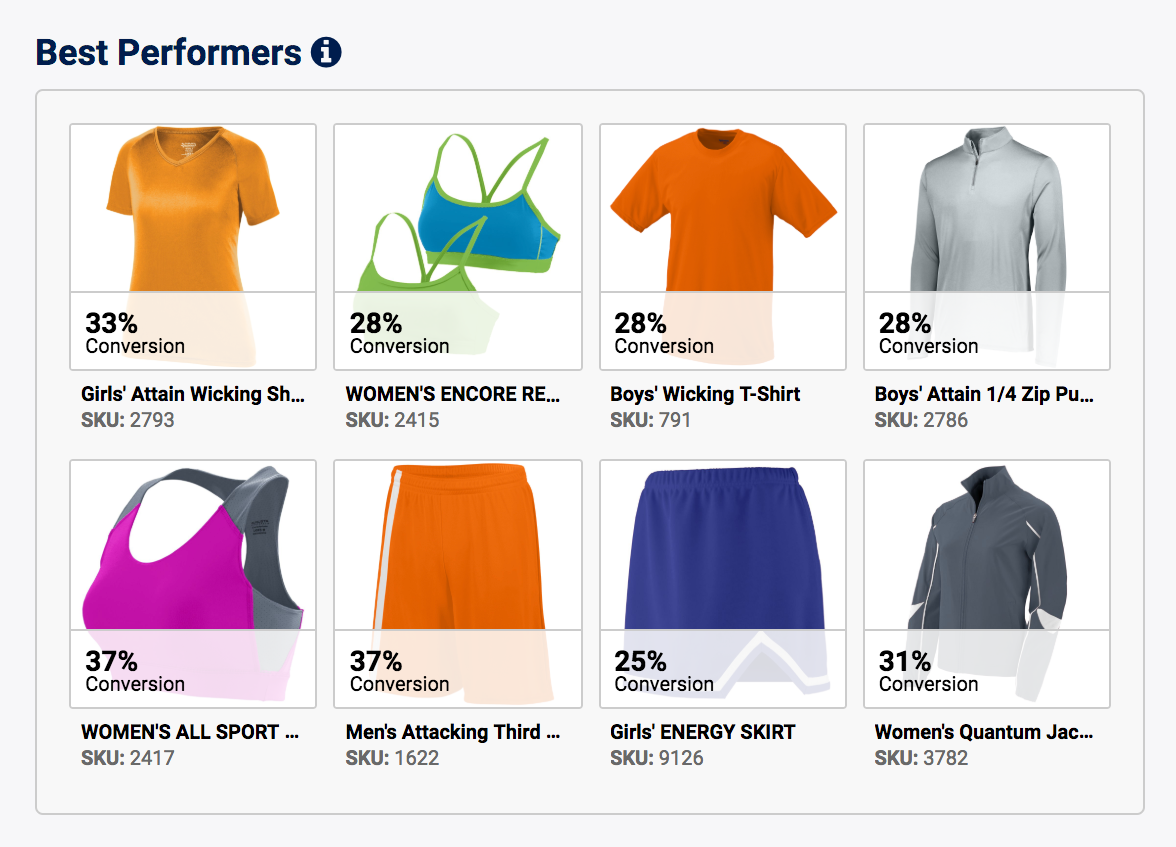
Quadrant: Best Performers
High conversion rate and many views! A lot of people see this product, and many who do go on to purchase it.
Suggested Action - Raise Price: Keep up the good work, and possibly consider raising the price on this high-demand product
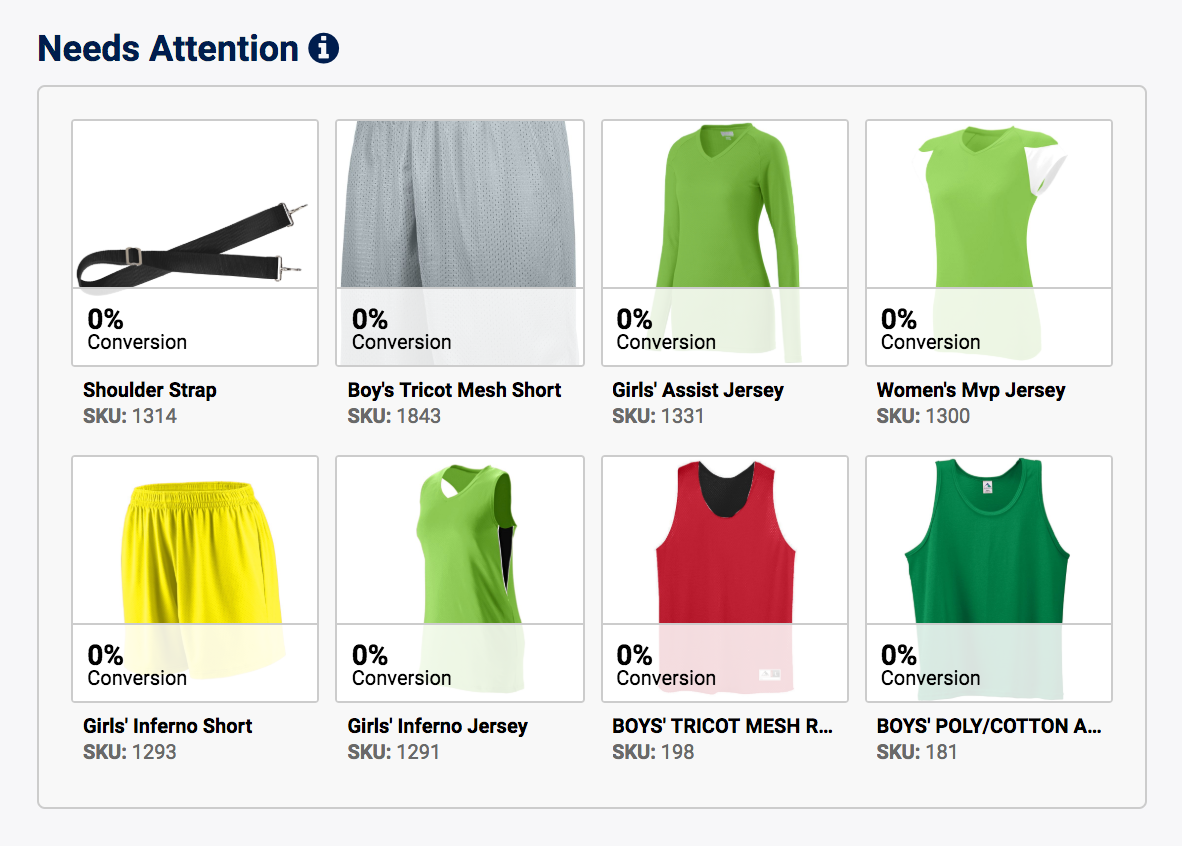
Quadrant: Needs Attention
Low conversion rate and low views. Not many people see this product, and those who do don't typically buy it.
Suggested Actions:
- Merchandise: Increase exposure by promoting the product
- Audit: Increase conversion by checking for page issues, or by lowering the price
- Prune: Remove the product from Google search results to decrease product bloat
Quadrant: Overexposed
Low conversion rate, but many views. A lot of customers are seeing this product, but few want to buy it.
Suggested Action - Audit: Increase conversion by checking for page issues, or by lowering the price
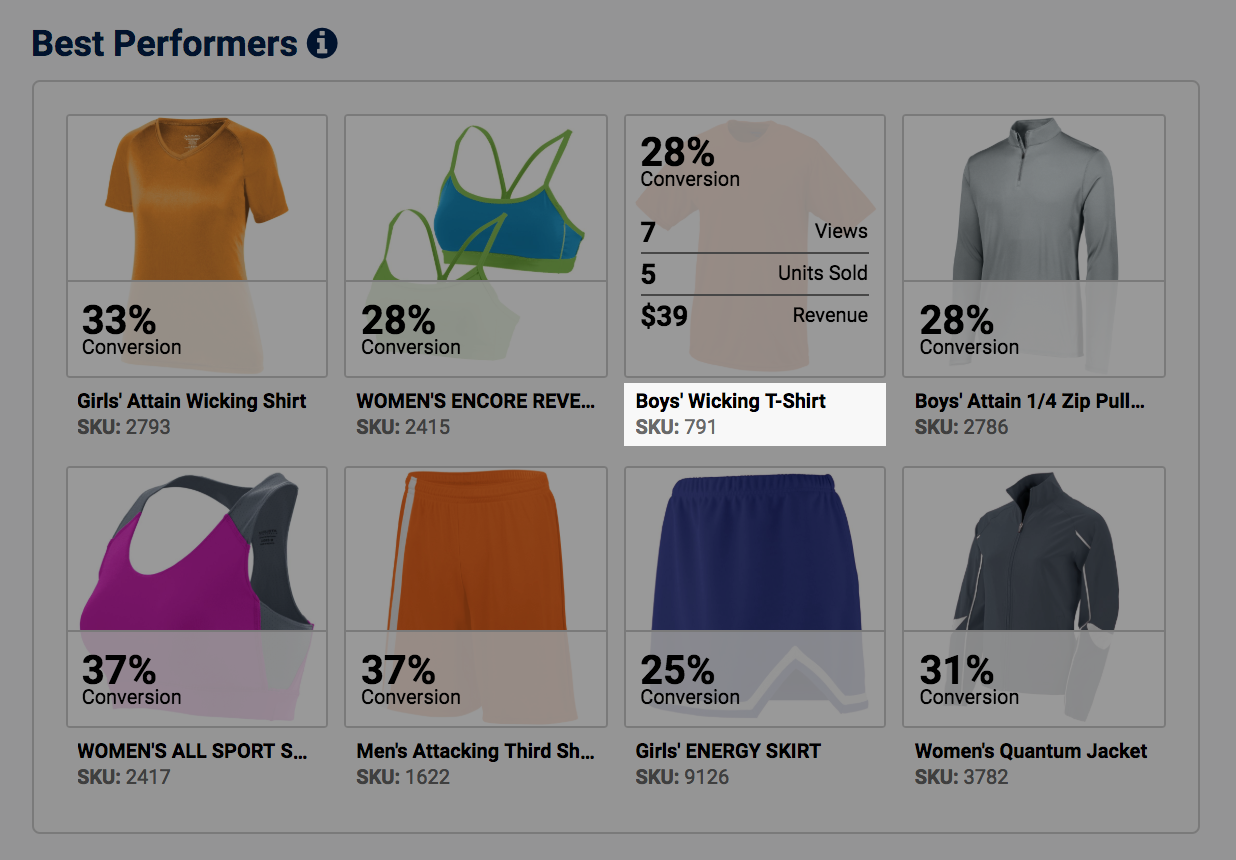
Product Name and SKU
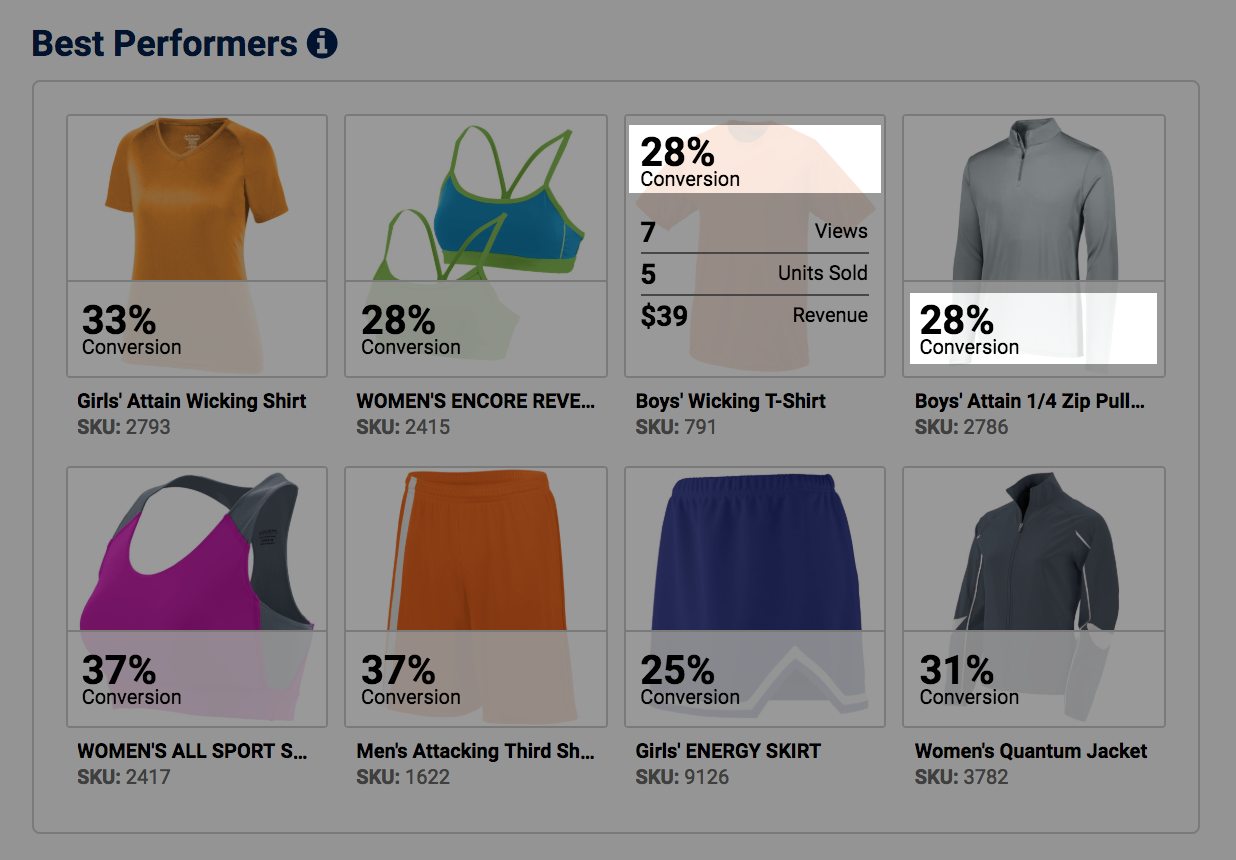
Conversion
Each product in a quadrant will show a high-level view of its conversion rate within your currently selected date range.
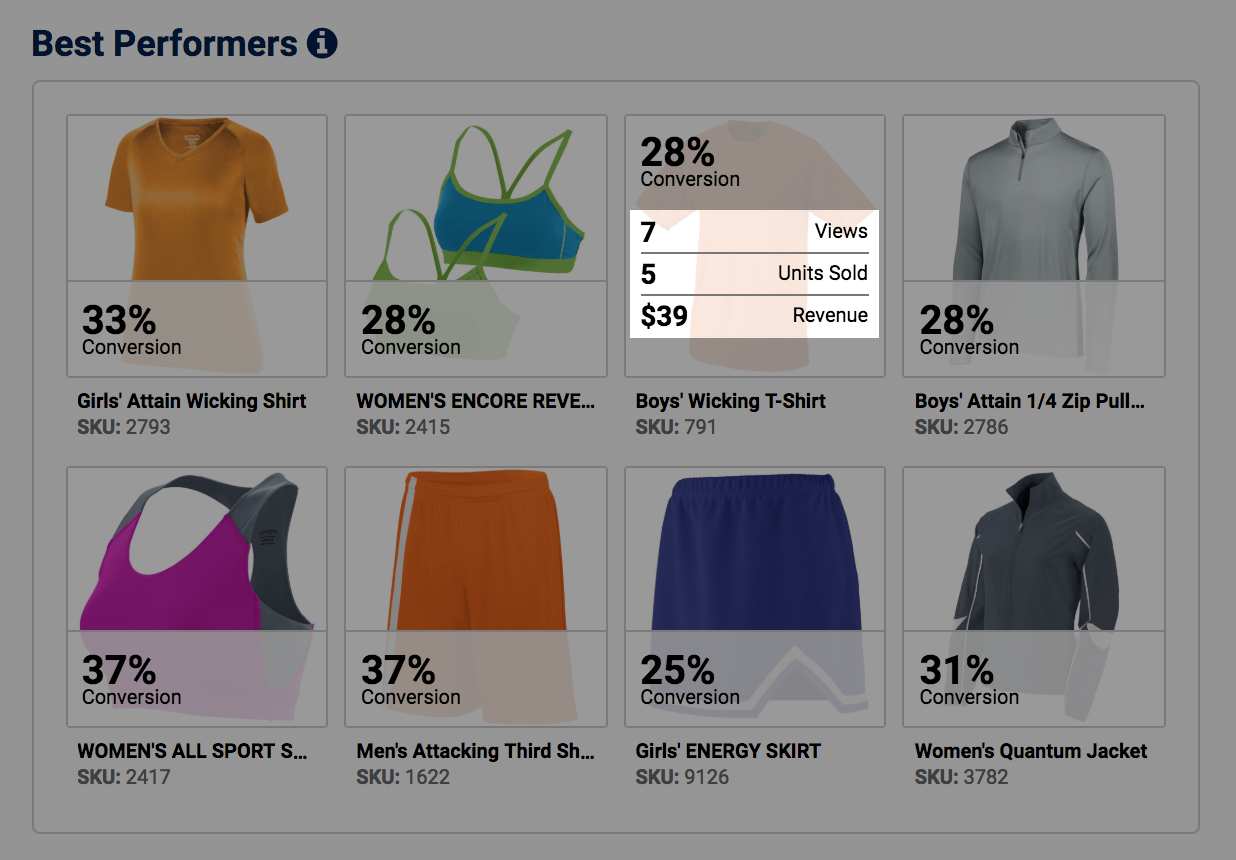
Views, Units Sold, and Revenue
Hovering over any product reveals some more granular details about its performance. You can click any product to get more info about its performance on the Product Insights Detail page.
Breakdown
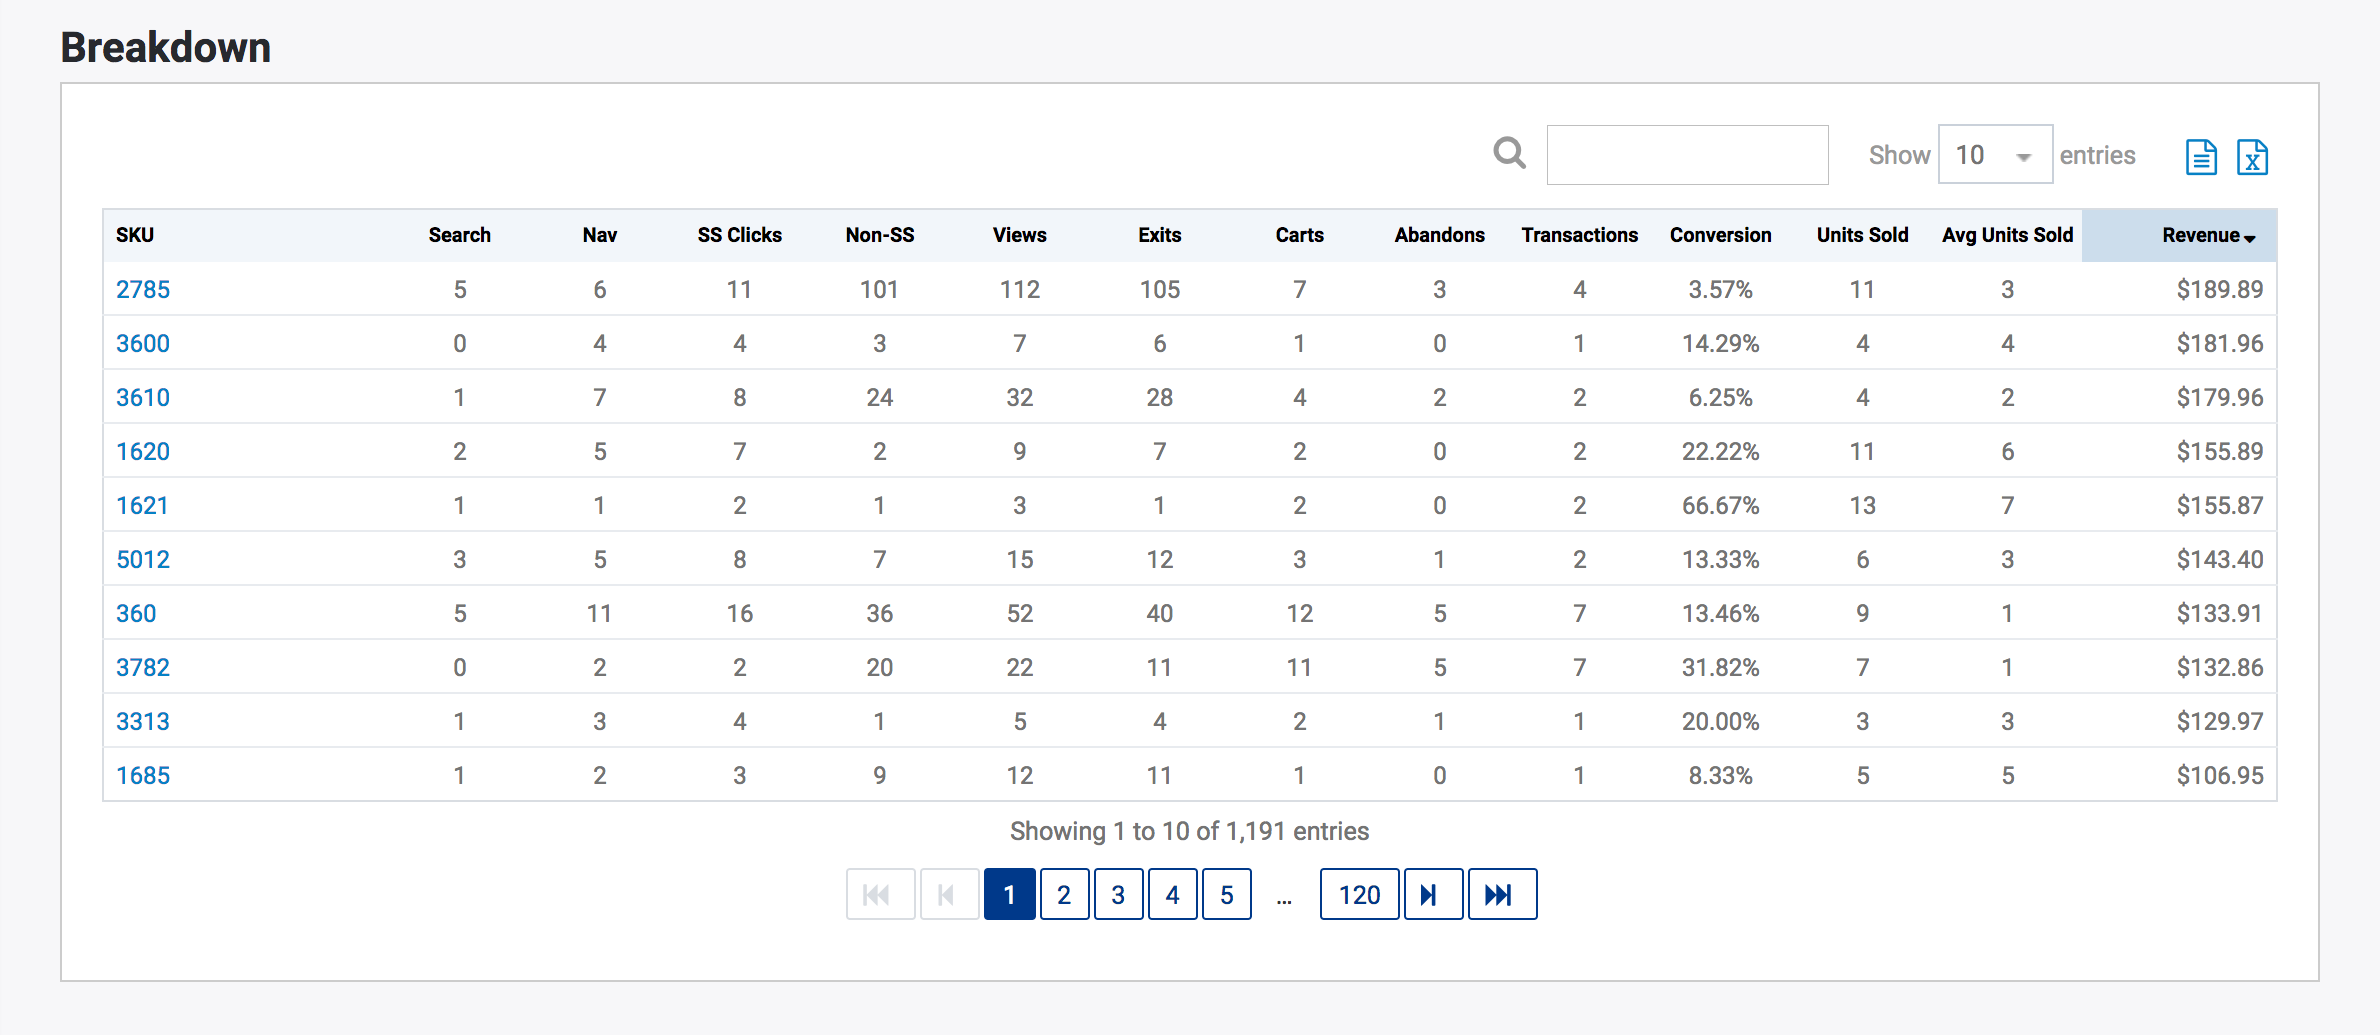
Beyond the quadrants you’ll find the Breakdown table, which has highly detailed information about every touched product. From views to carts to revenue, there are many ways to breakdown, sort, filter, and analyze this raw information.
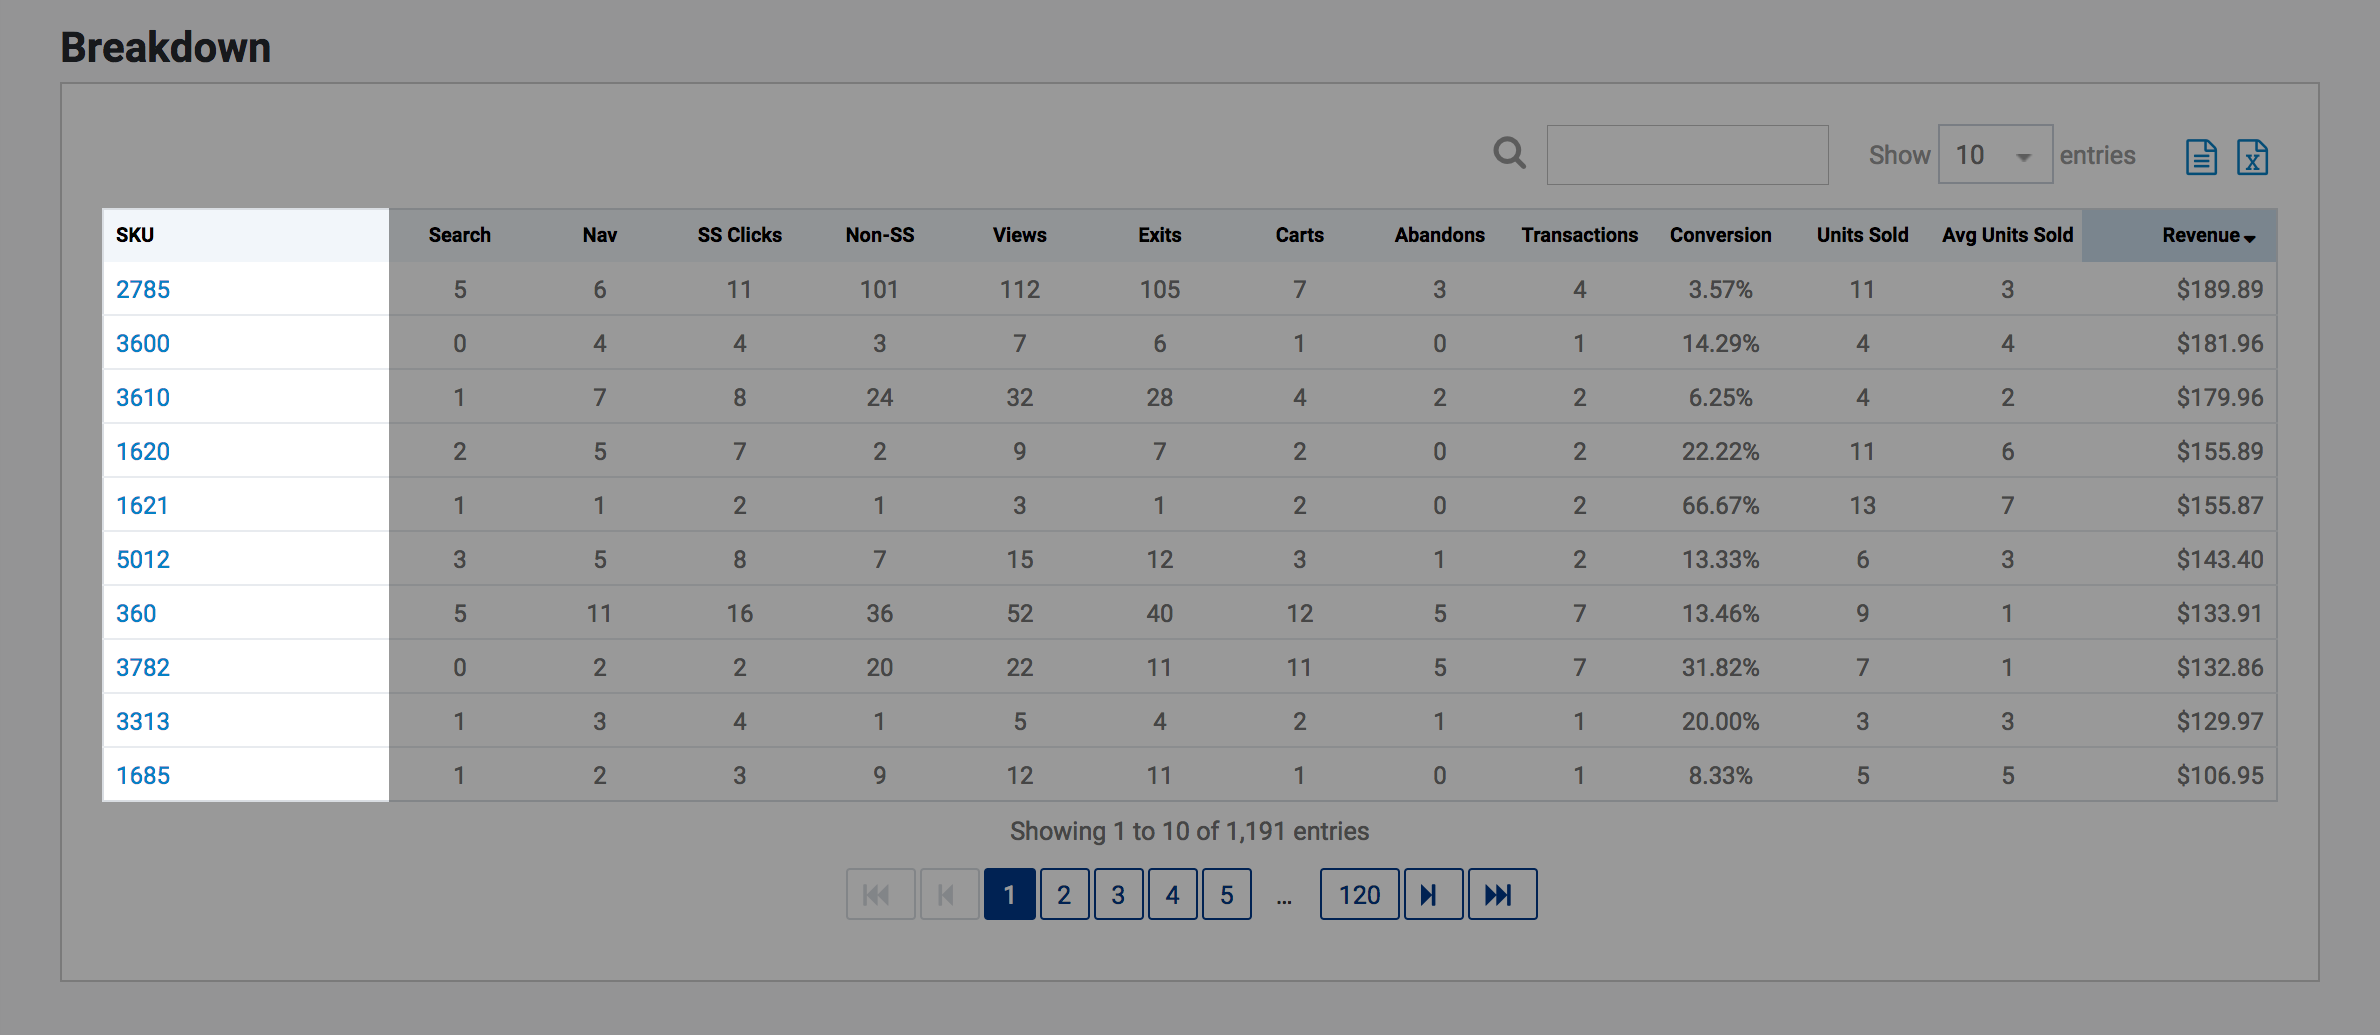
SKU
The SKU of the product for this row. You can click any SKU to get more info about its performance on the Product Insights Detail page.
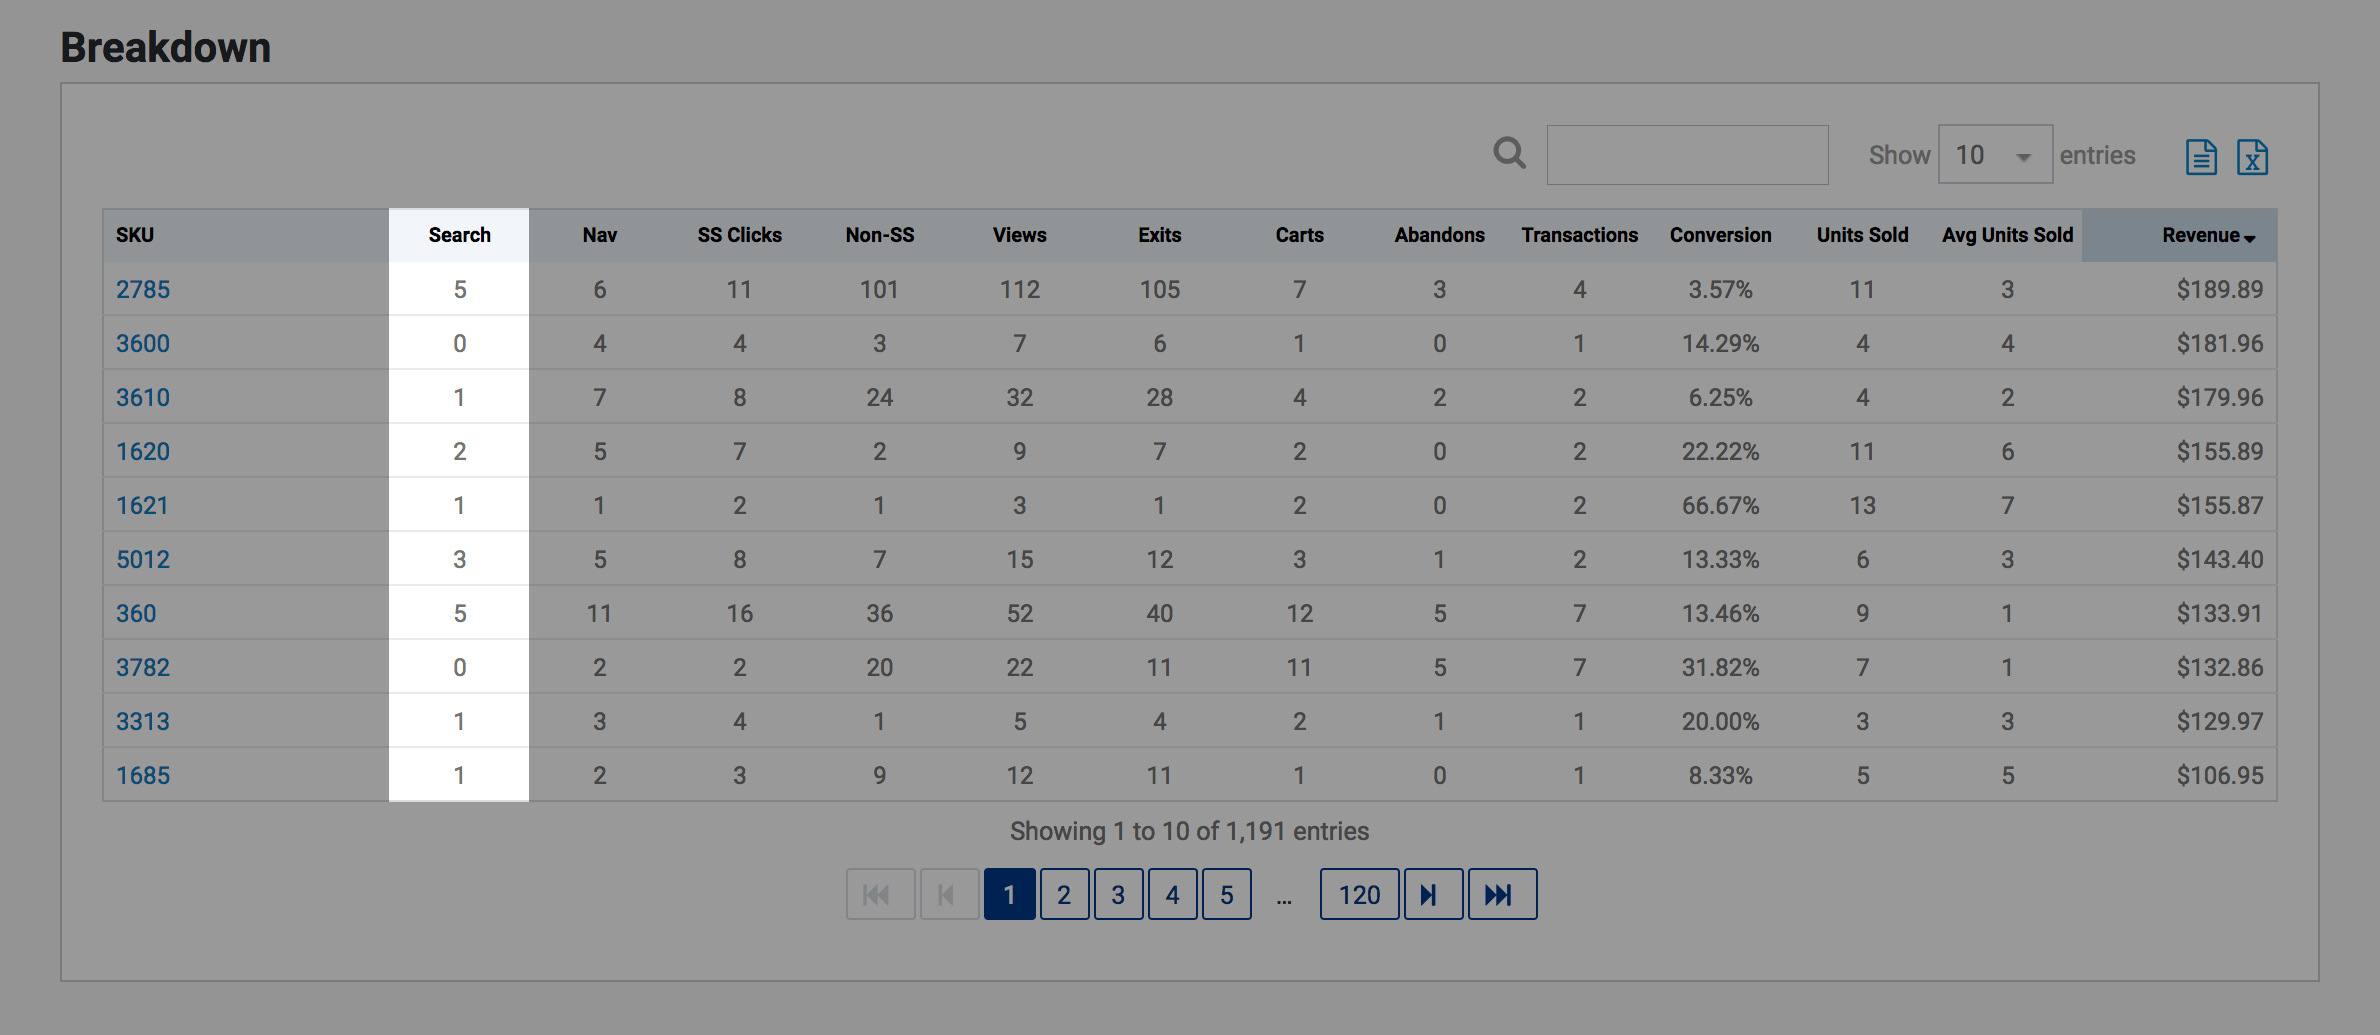
Search
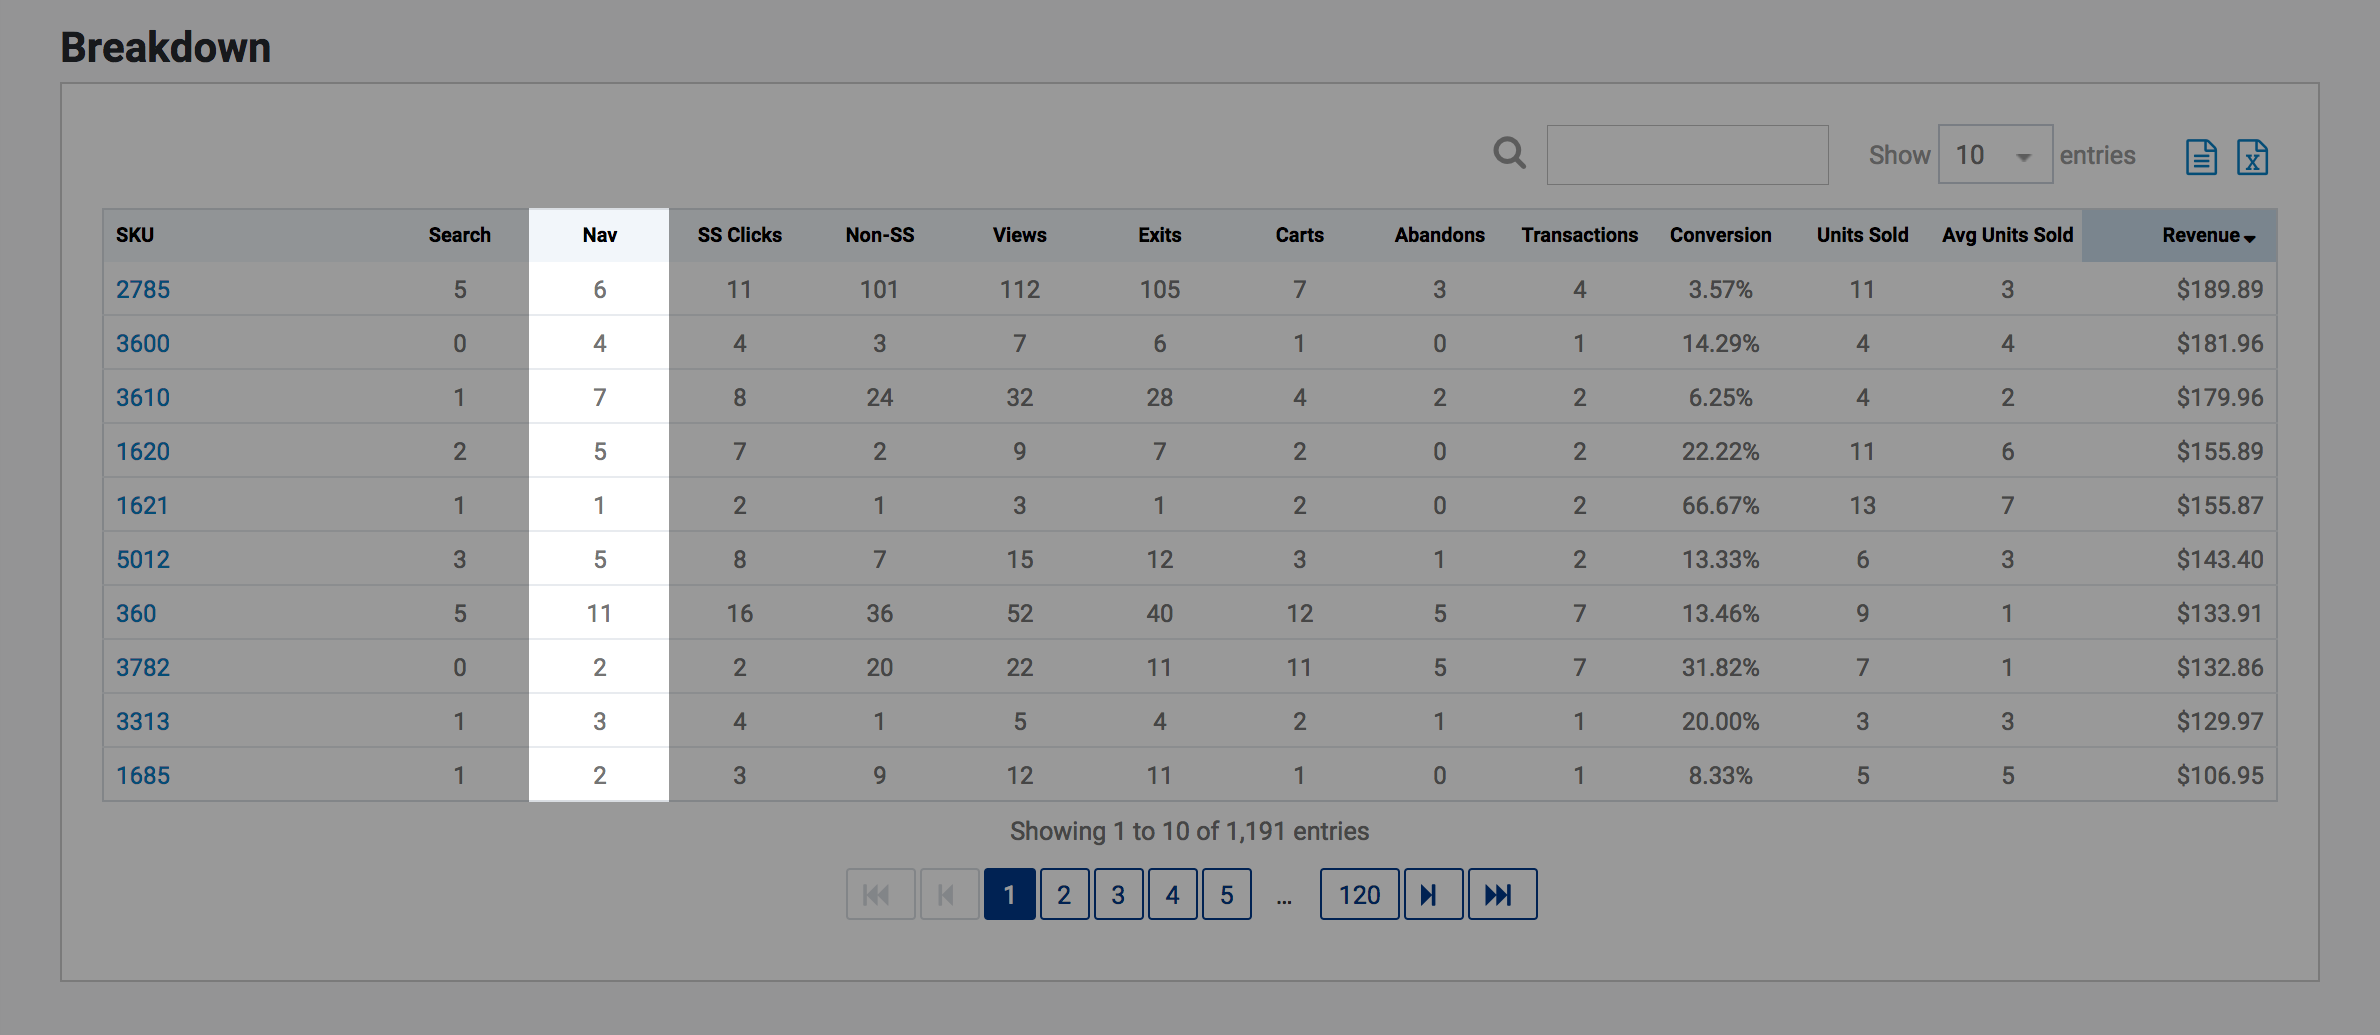
Nav
How many clicks for this product resulted from a customer browsing category navigation on your site.
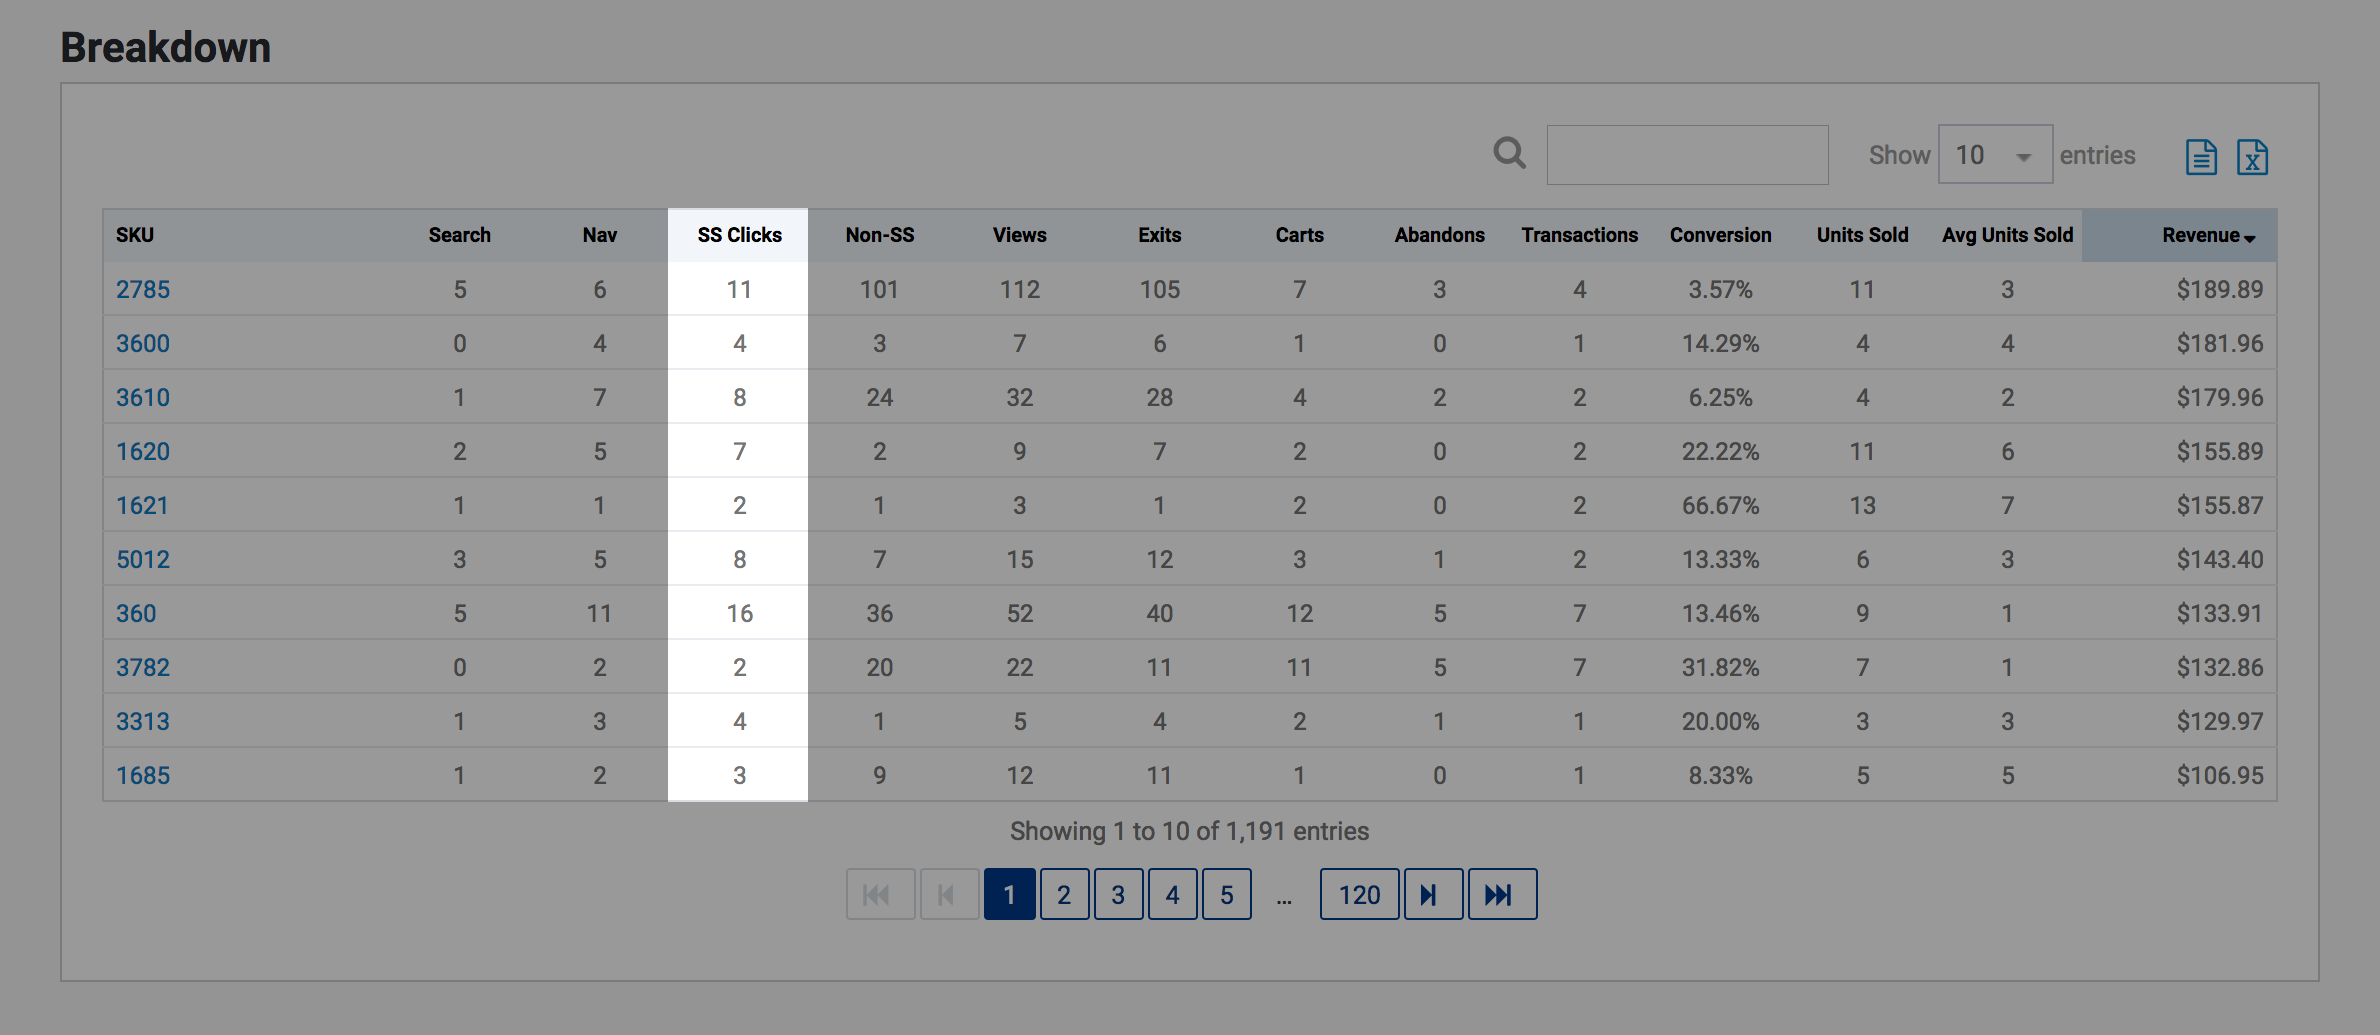
SS Clicks
The total number of clicks from any Searchspring-powered page.
Calculation: Search Clicks + Nav Clicks (the 2 columns to the left)
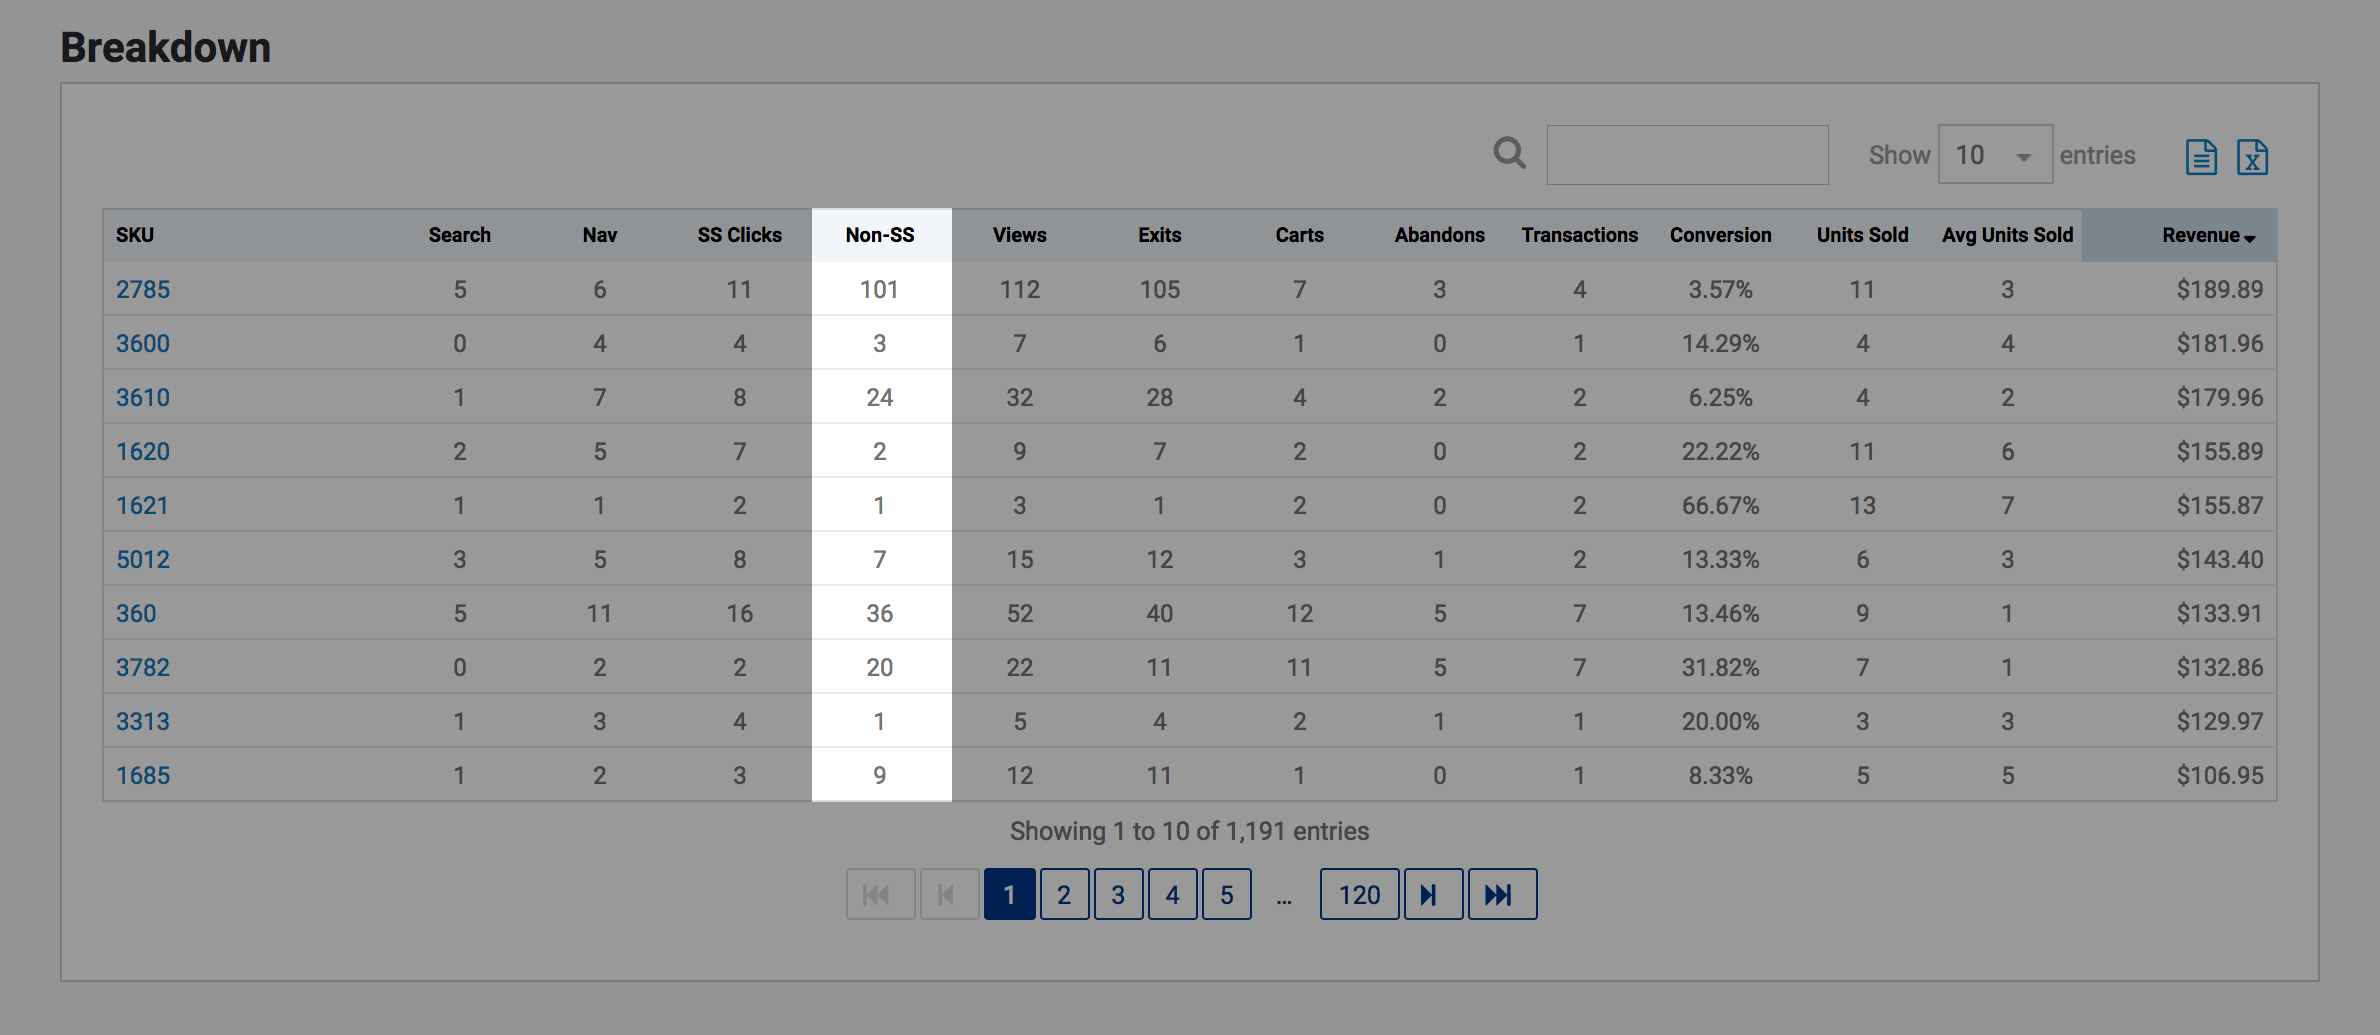
Non-SS
The total number of times this product was viewed, and not as a result from being clicked in a Searchspring-powered page.
Calculation: Views - SS Clicks
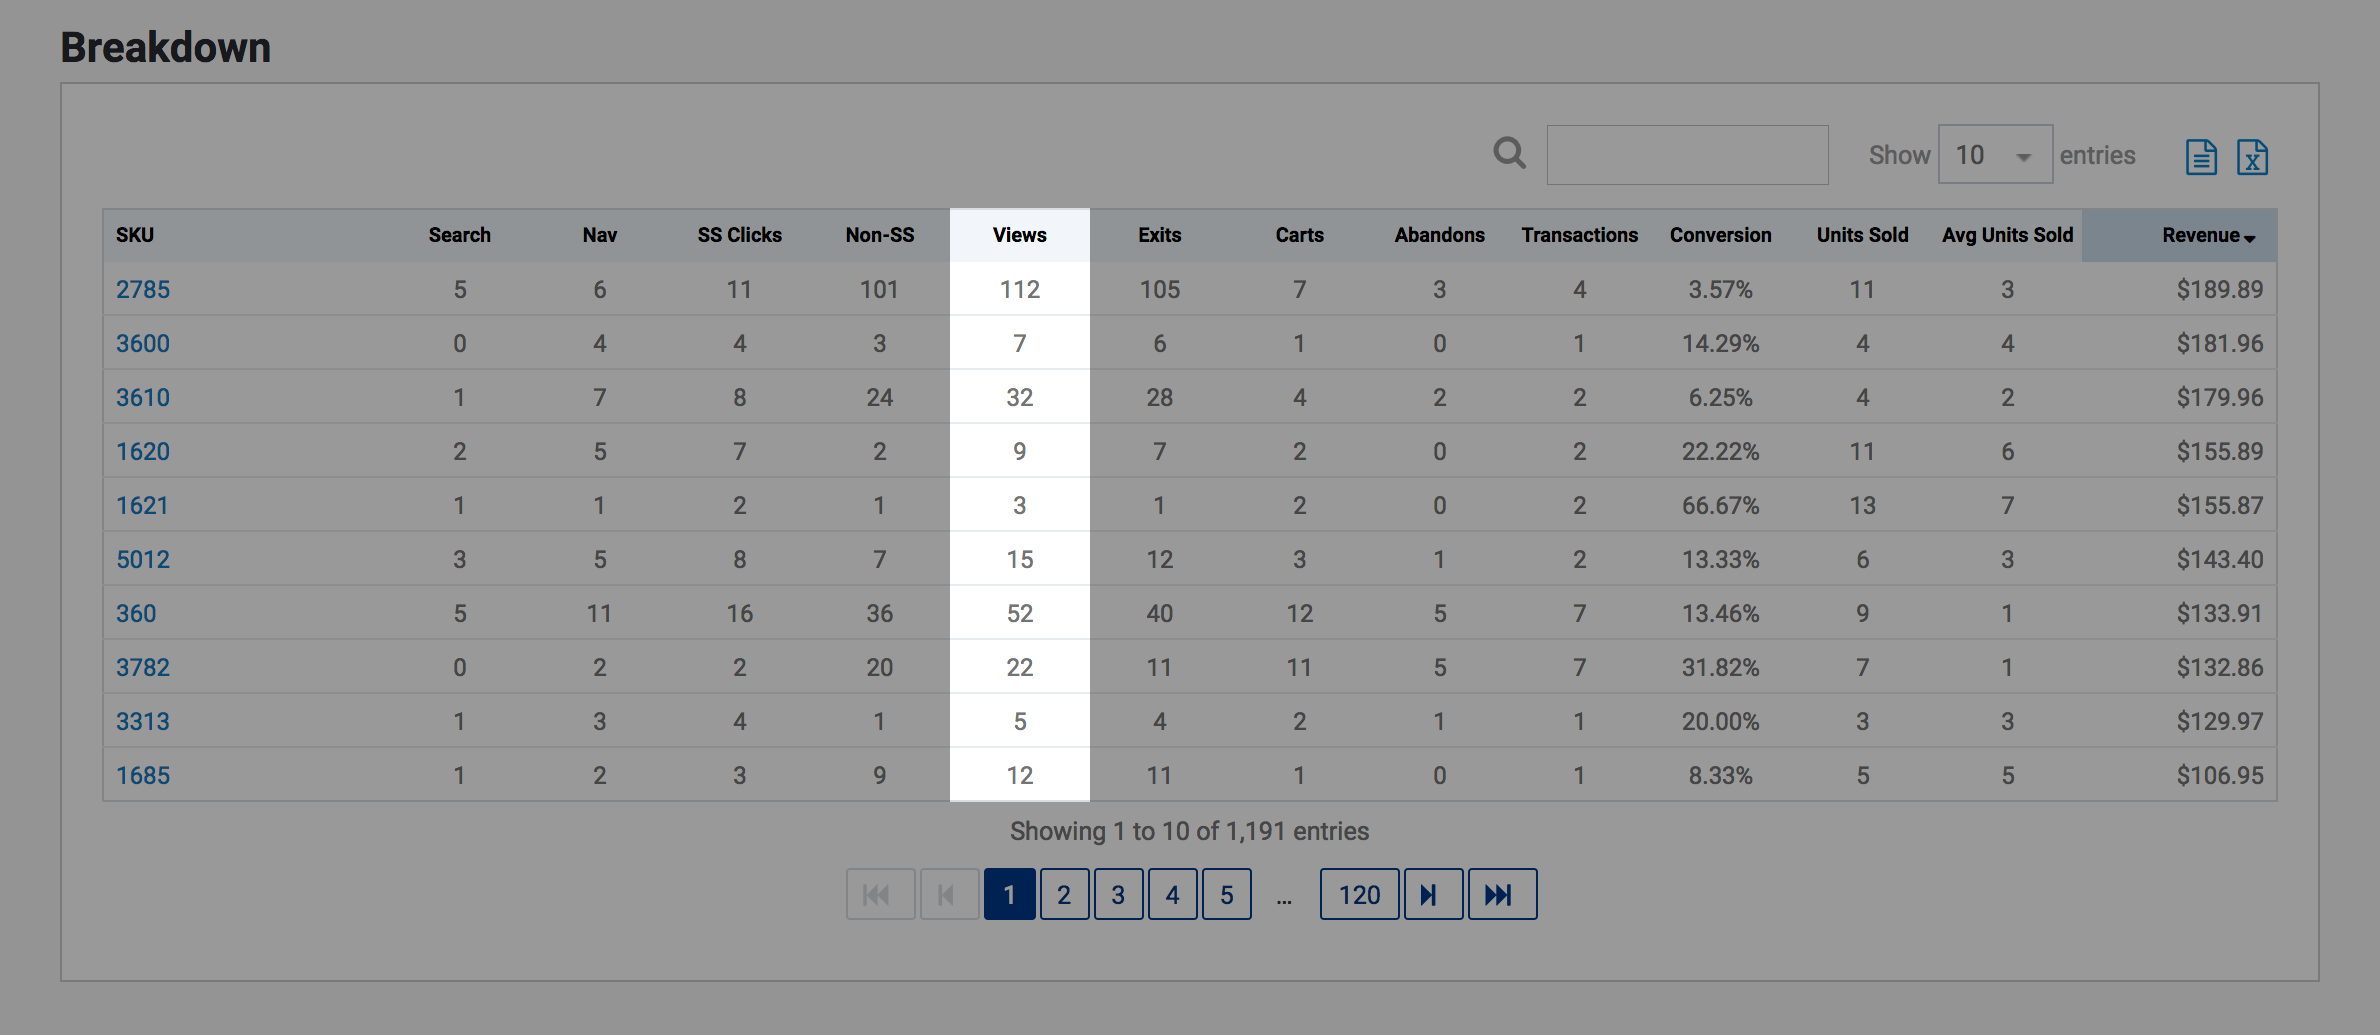
Views
The total number of times this product was viewed during your selected date range. Requires IntelliSuggest view tracking to be installed on your site.
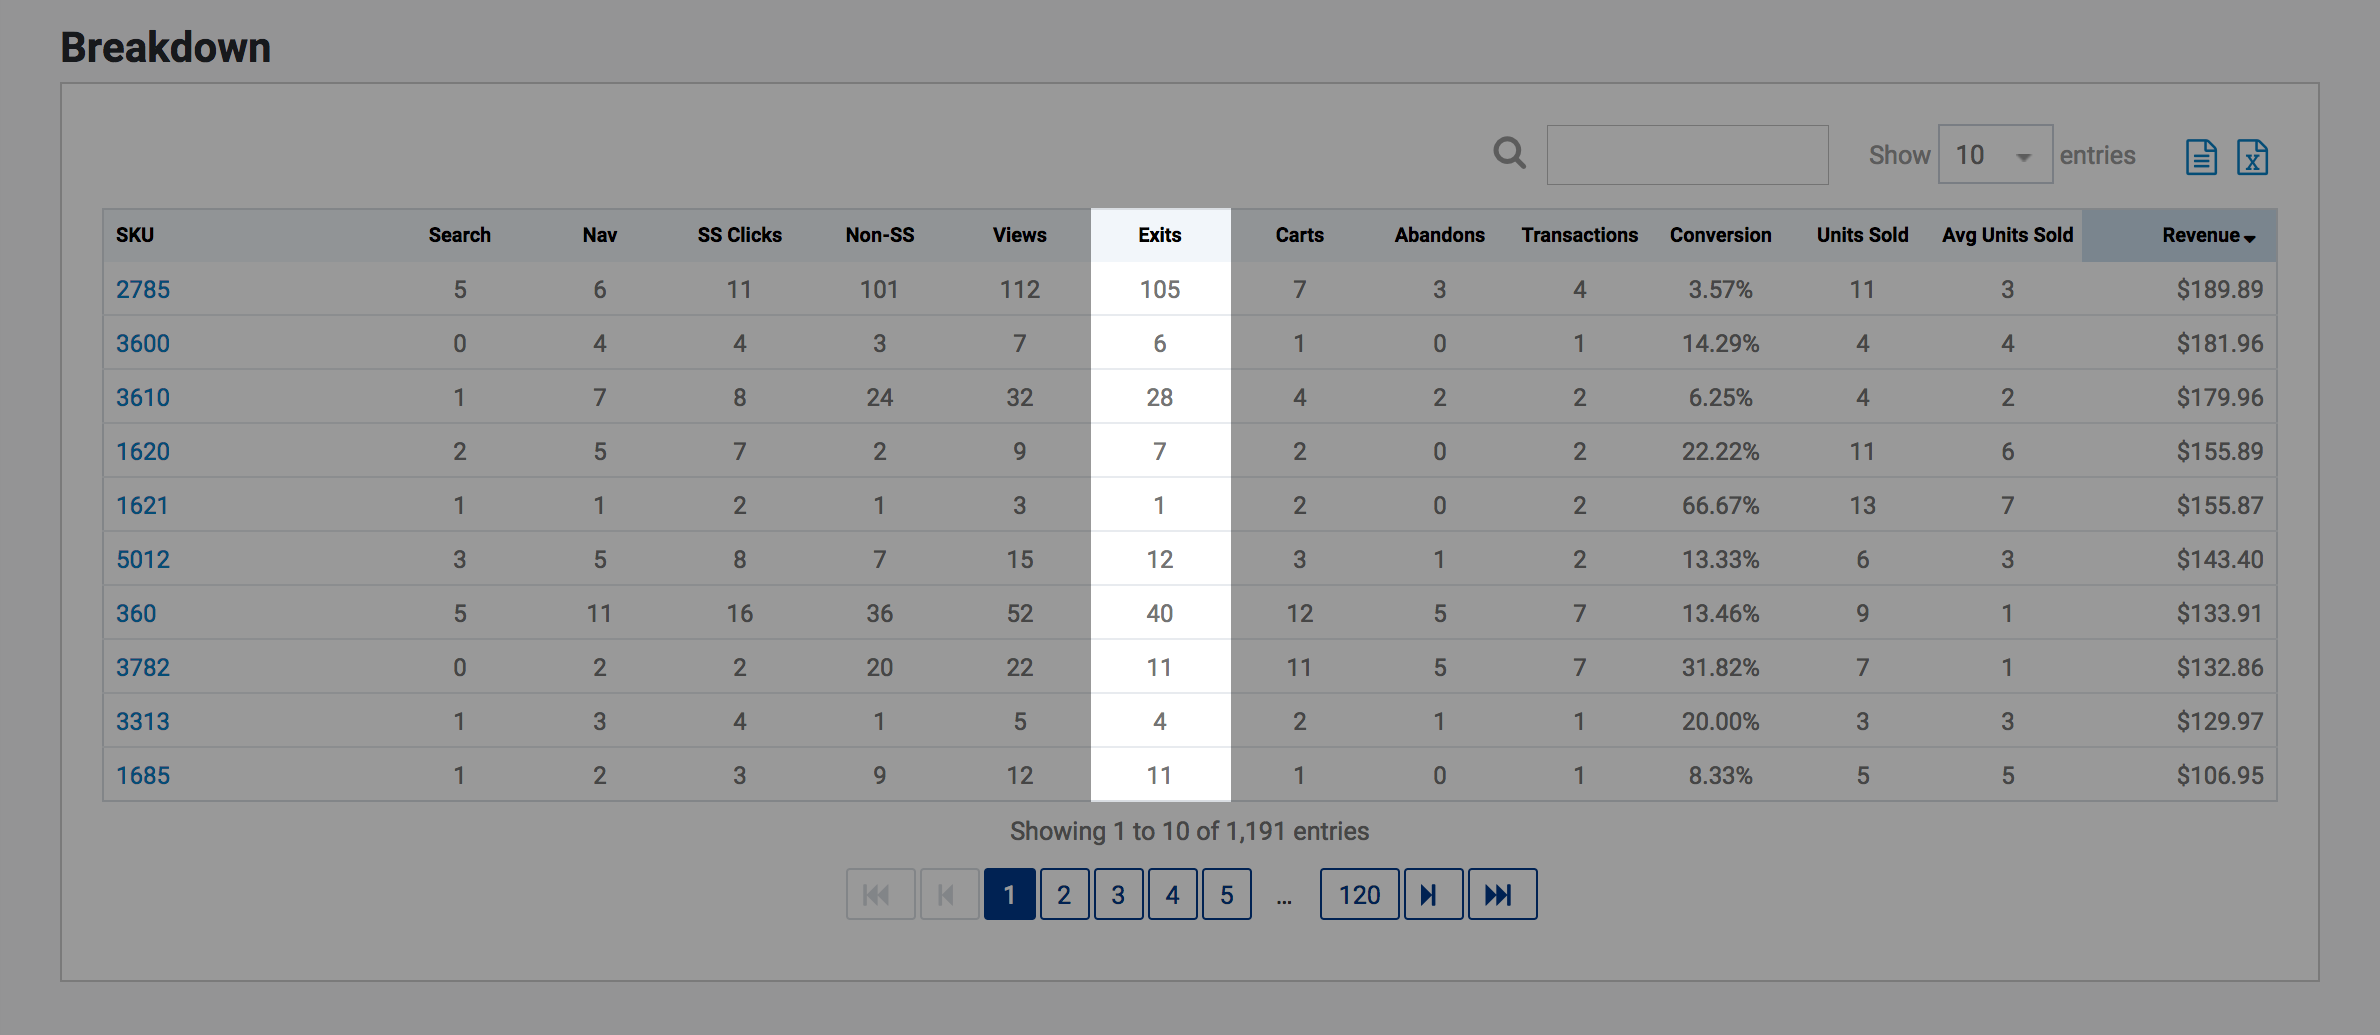
Exits
The difference between the number of Views a product had versus how many times it was added to someone's cart.
Calculation: Carts - Views
Carts
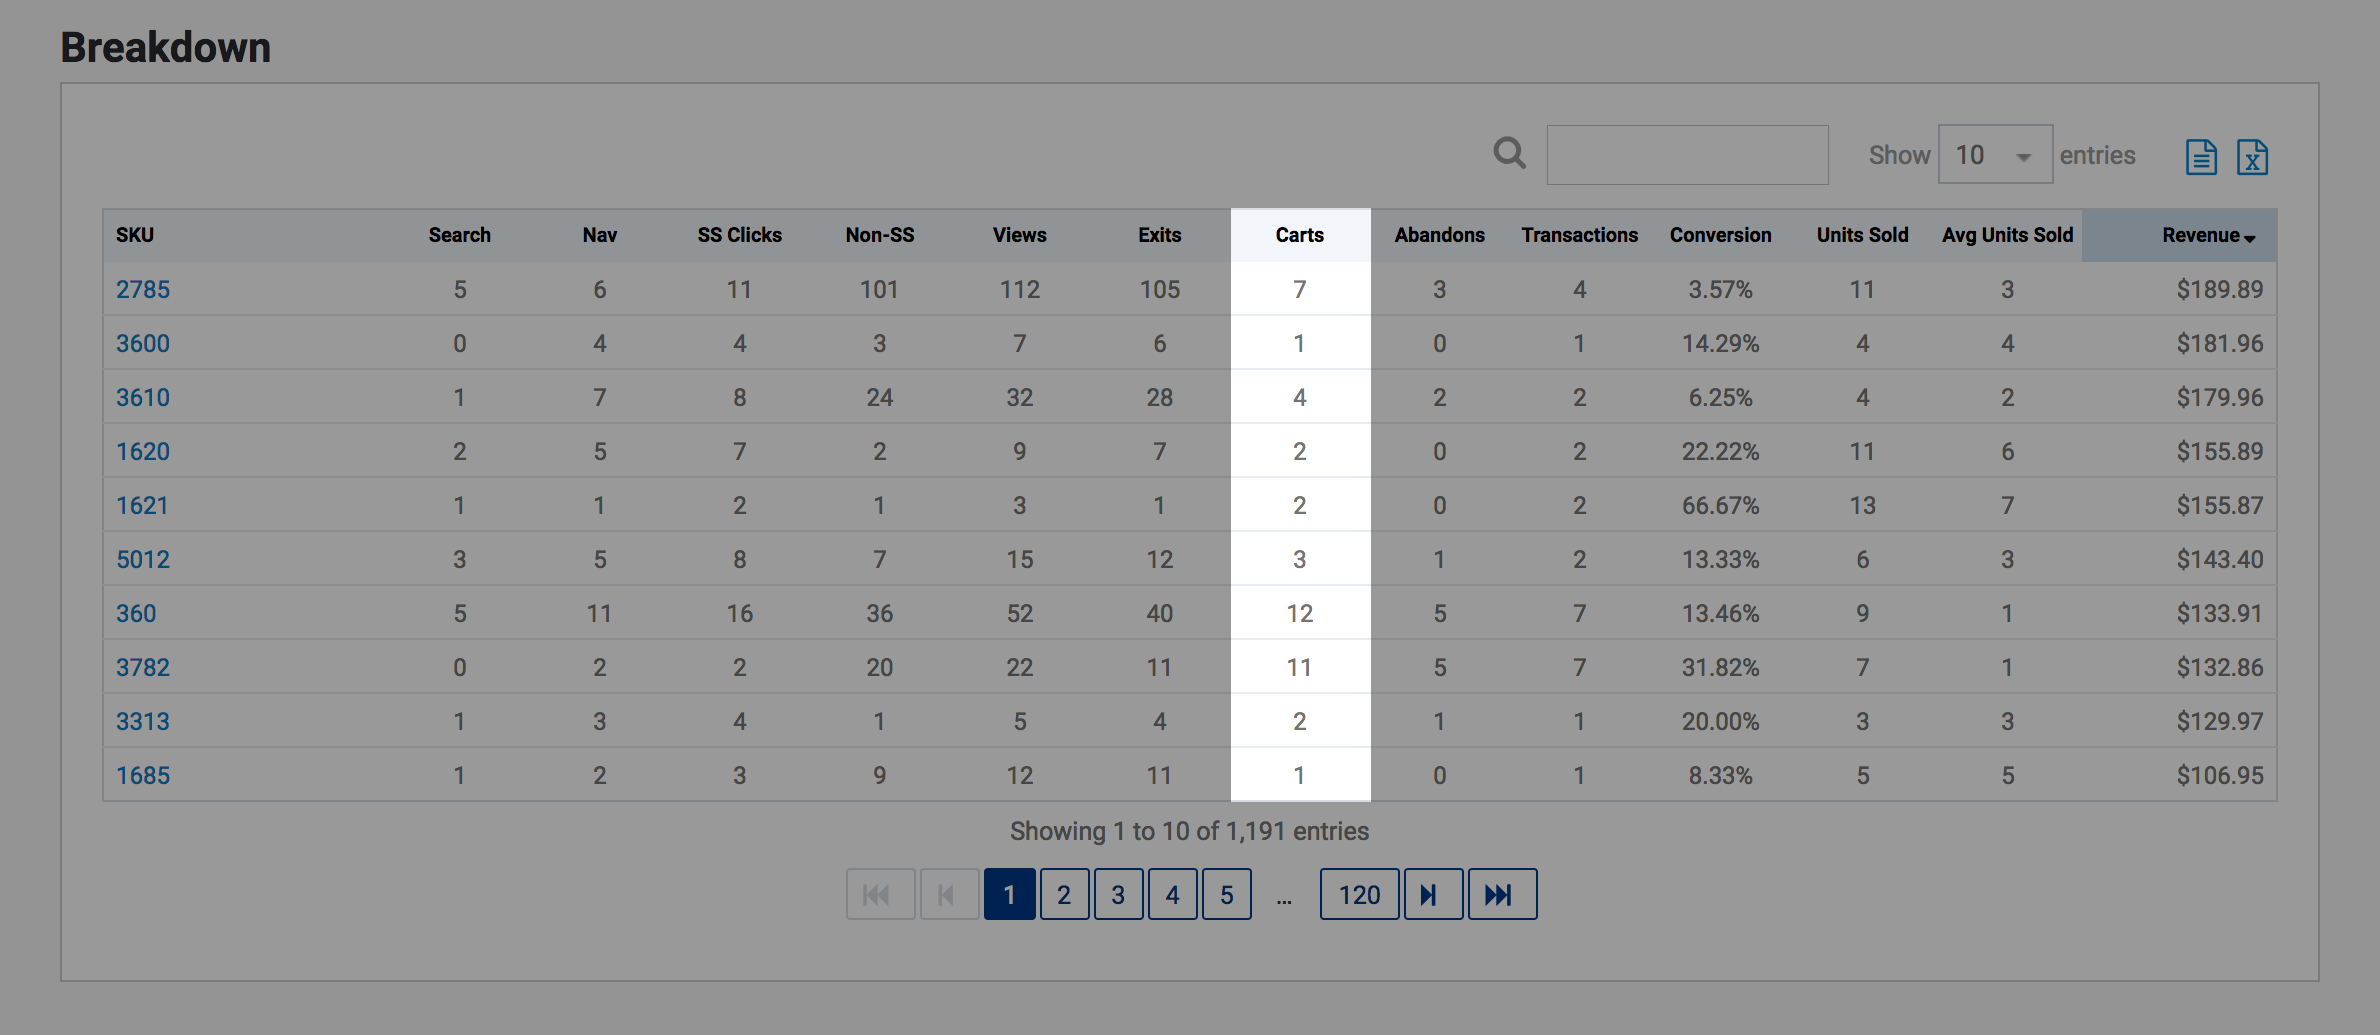
The number of times this product was added to someone's cart. Requires IntelliSuggest Cart tracking to be tracked on this report.
Abandons
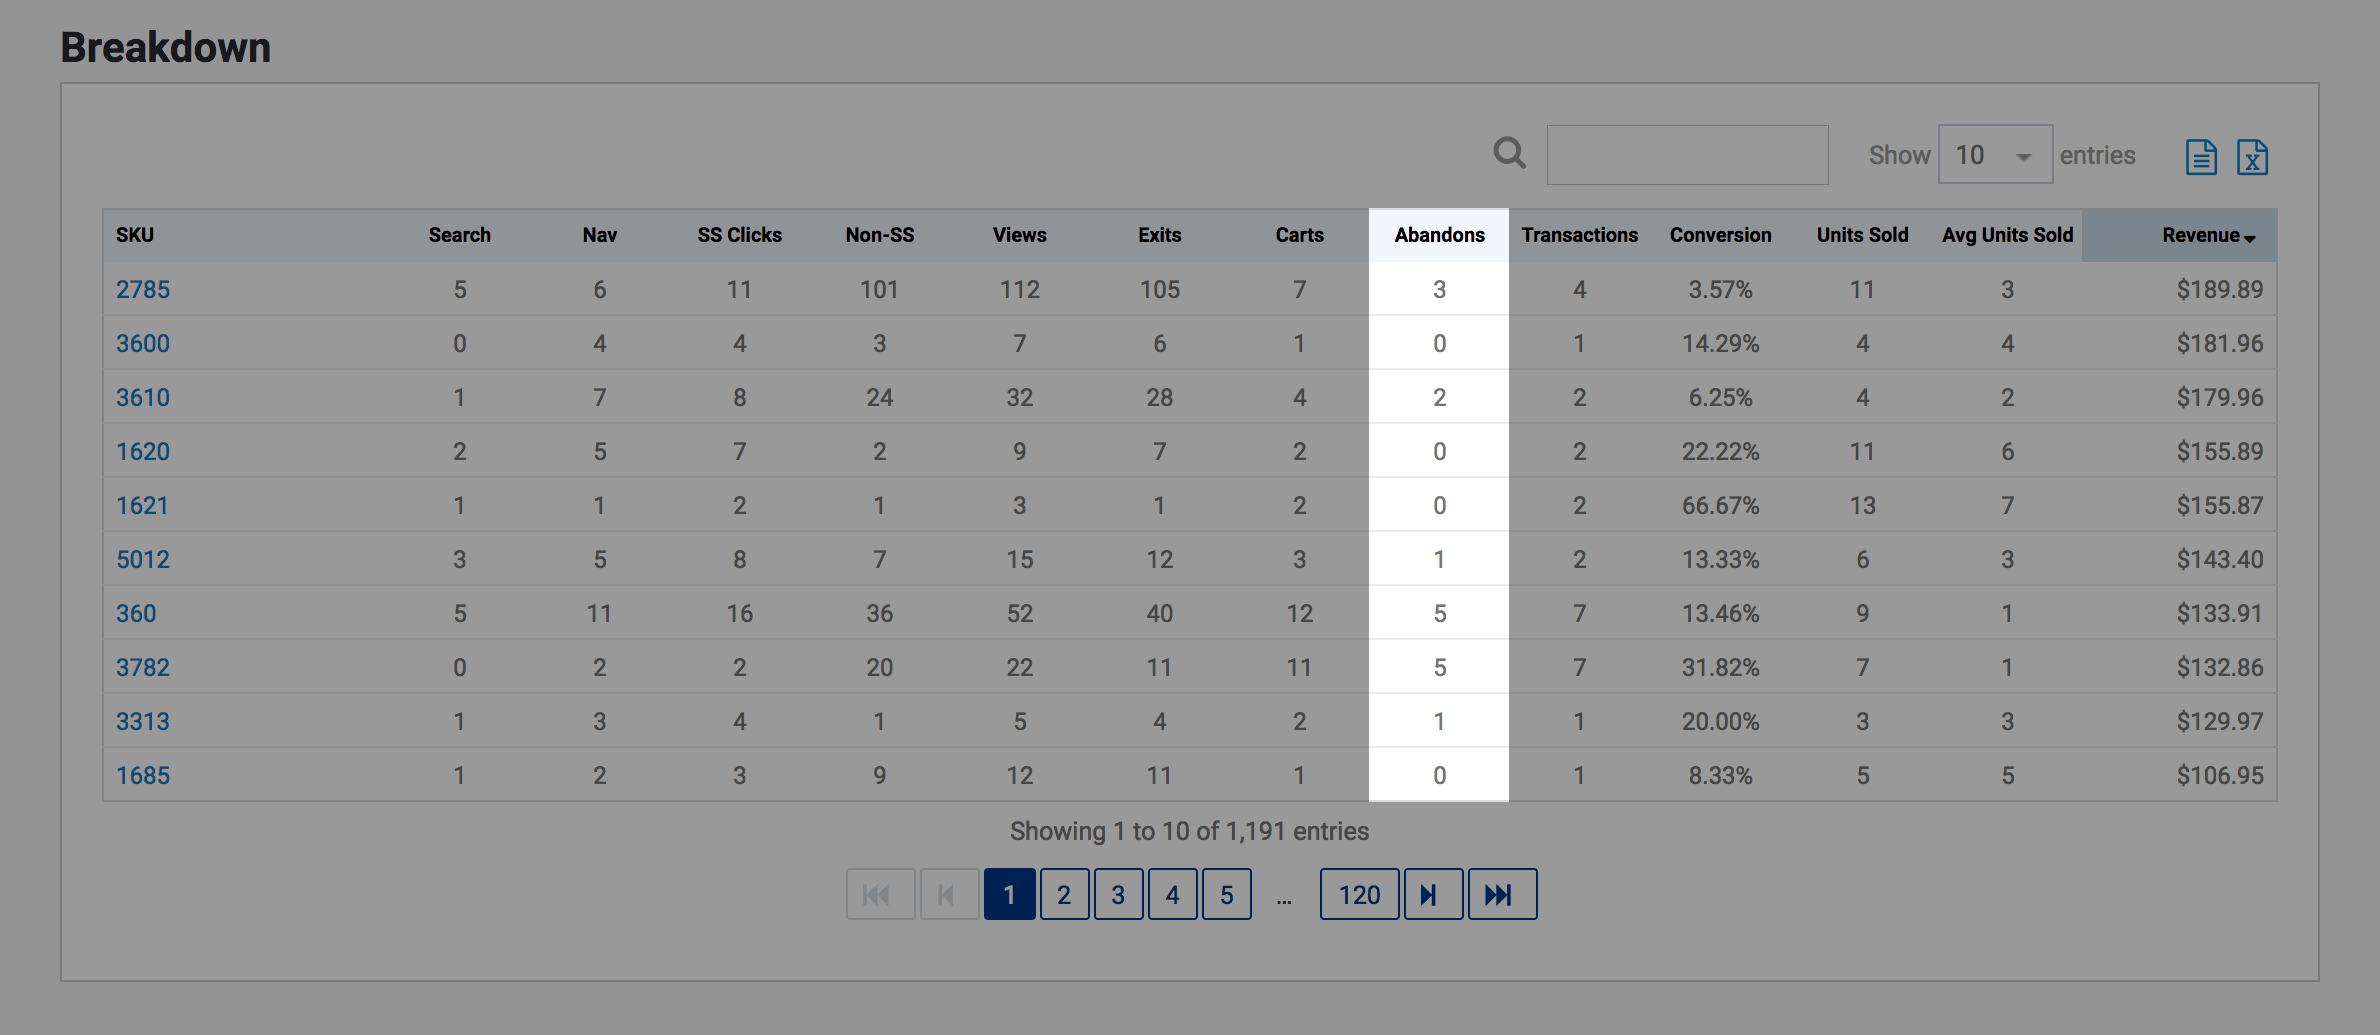
The difference between the number of times this product was added to a cart versus how many times it was purchased.
Calculation: Transactions - Carts
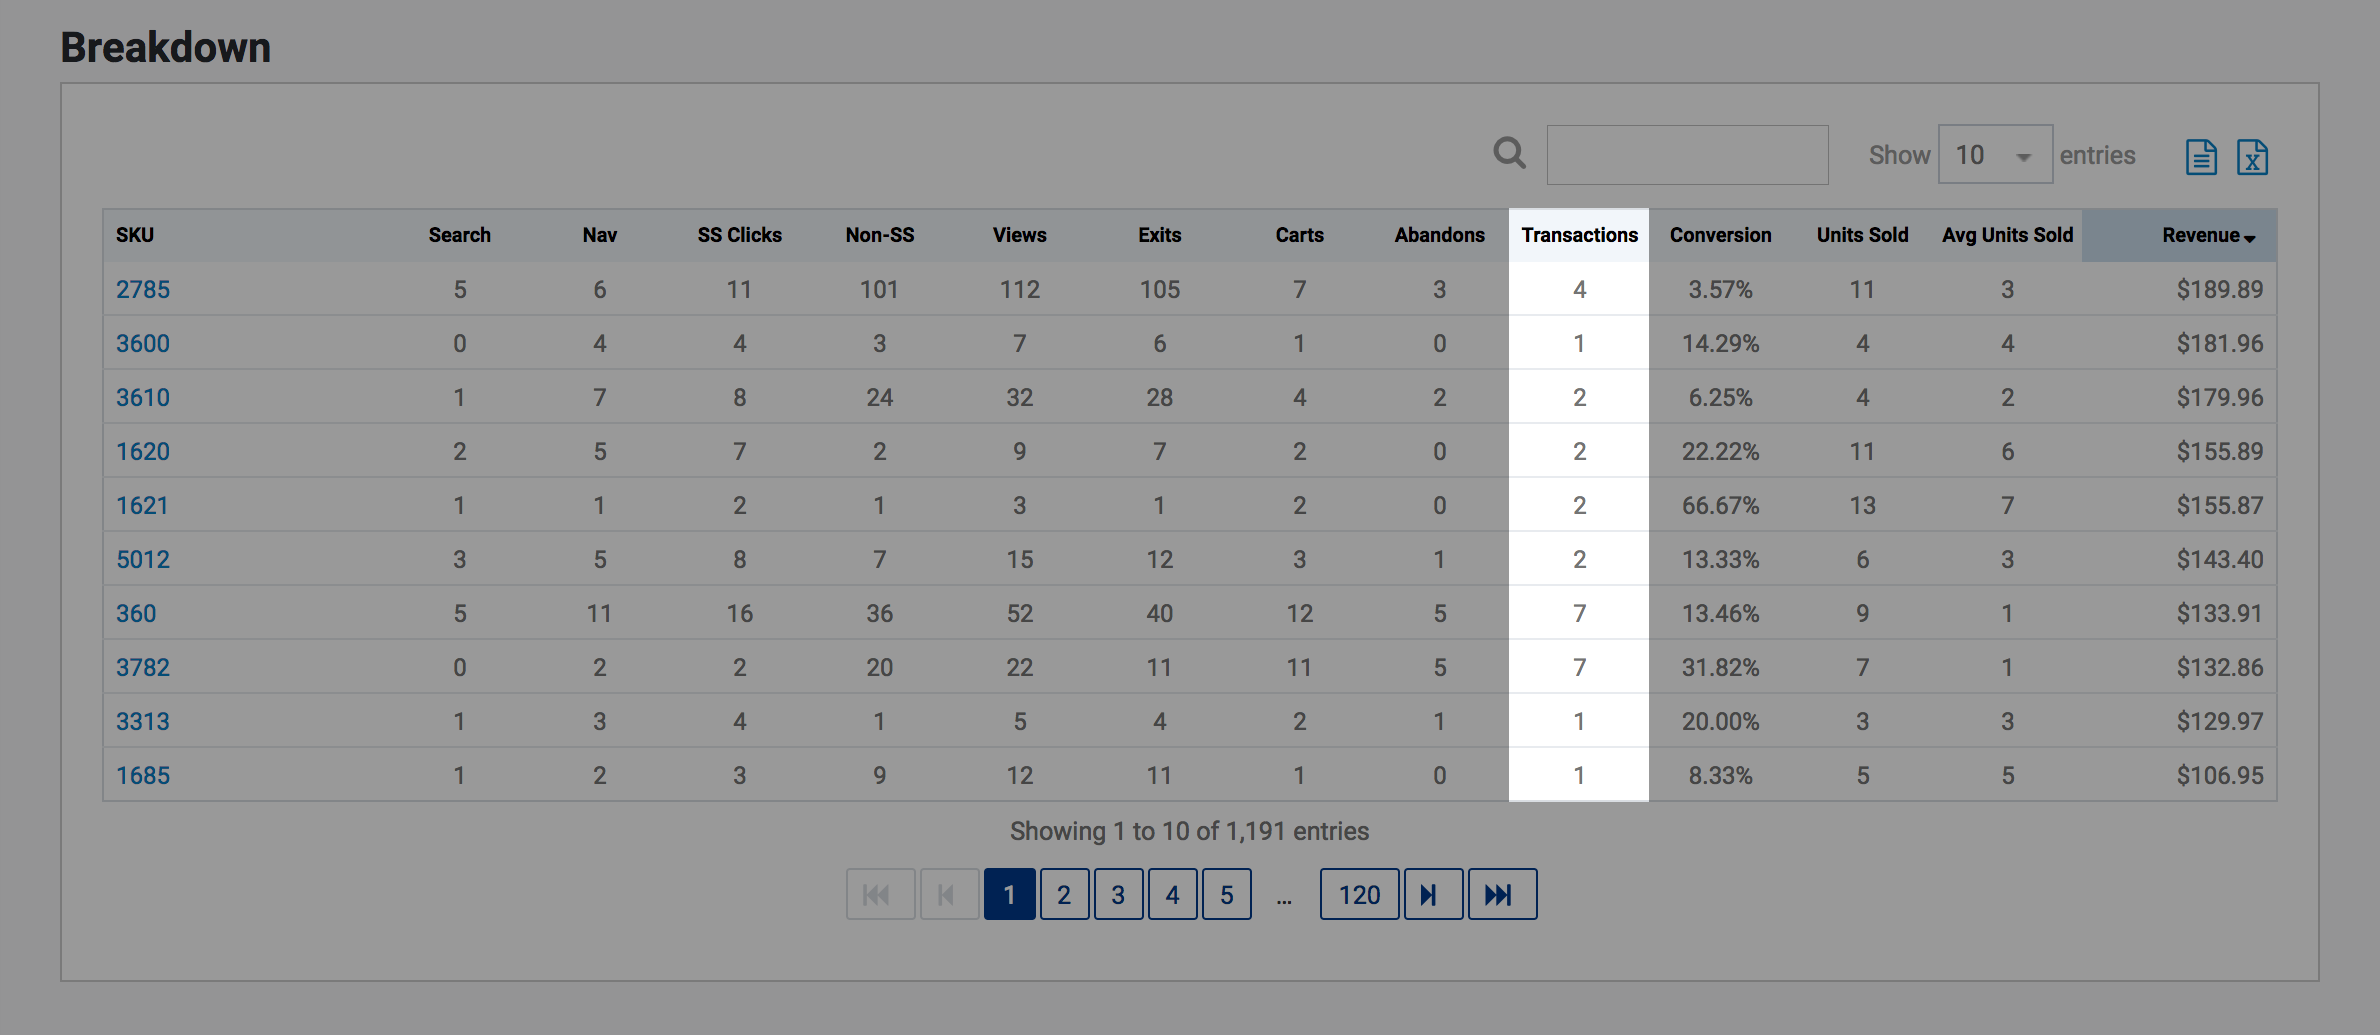
Transactions
Conversion
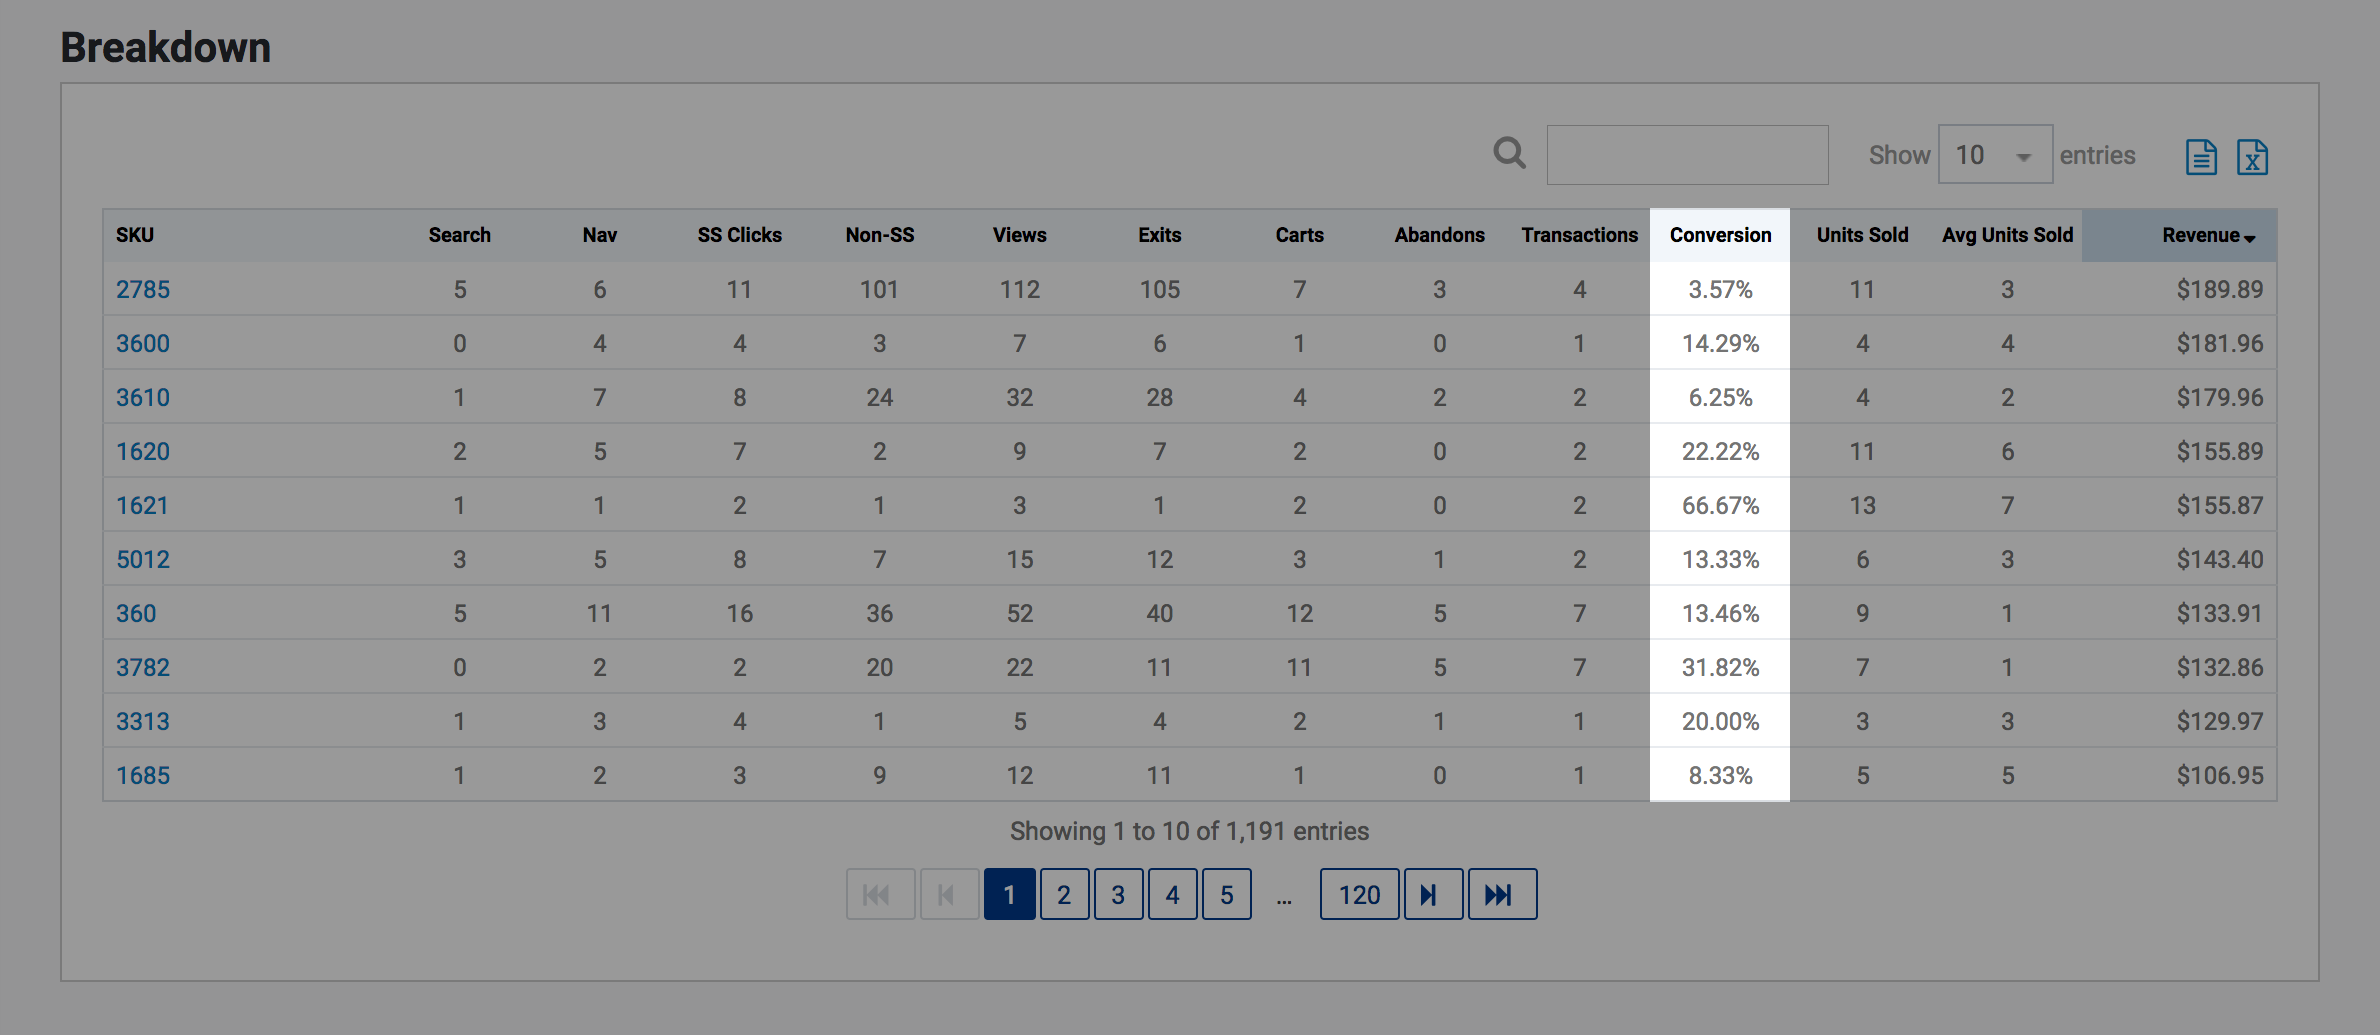
The overall conversion rate of this product during your selected date range.
Calculation: Transactions ÷ Views
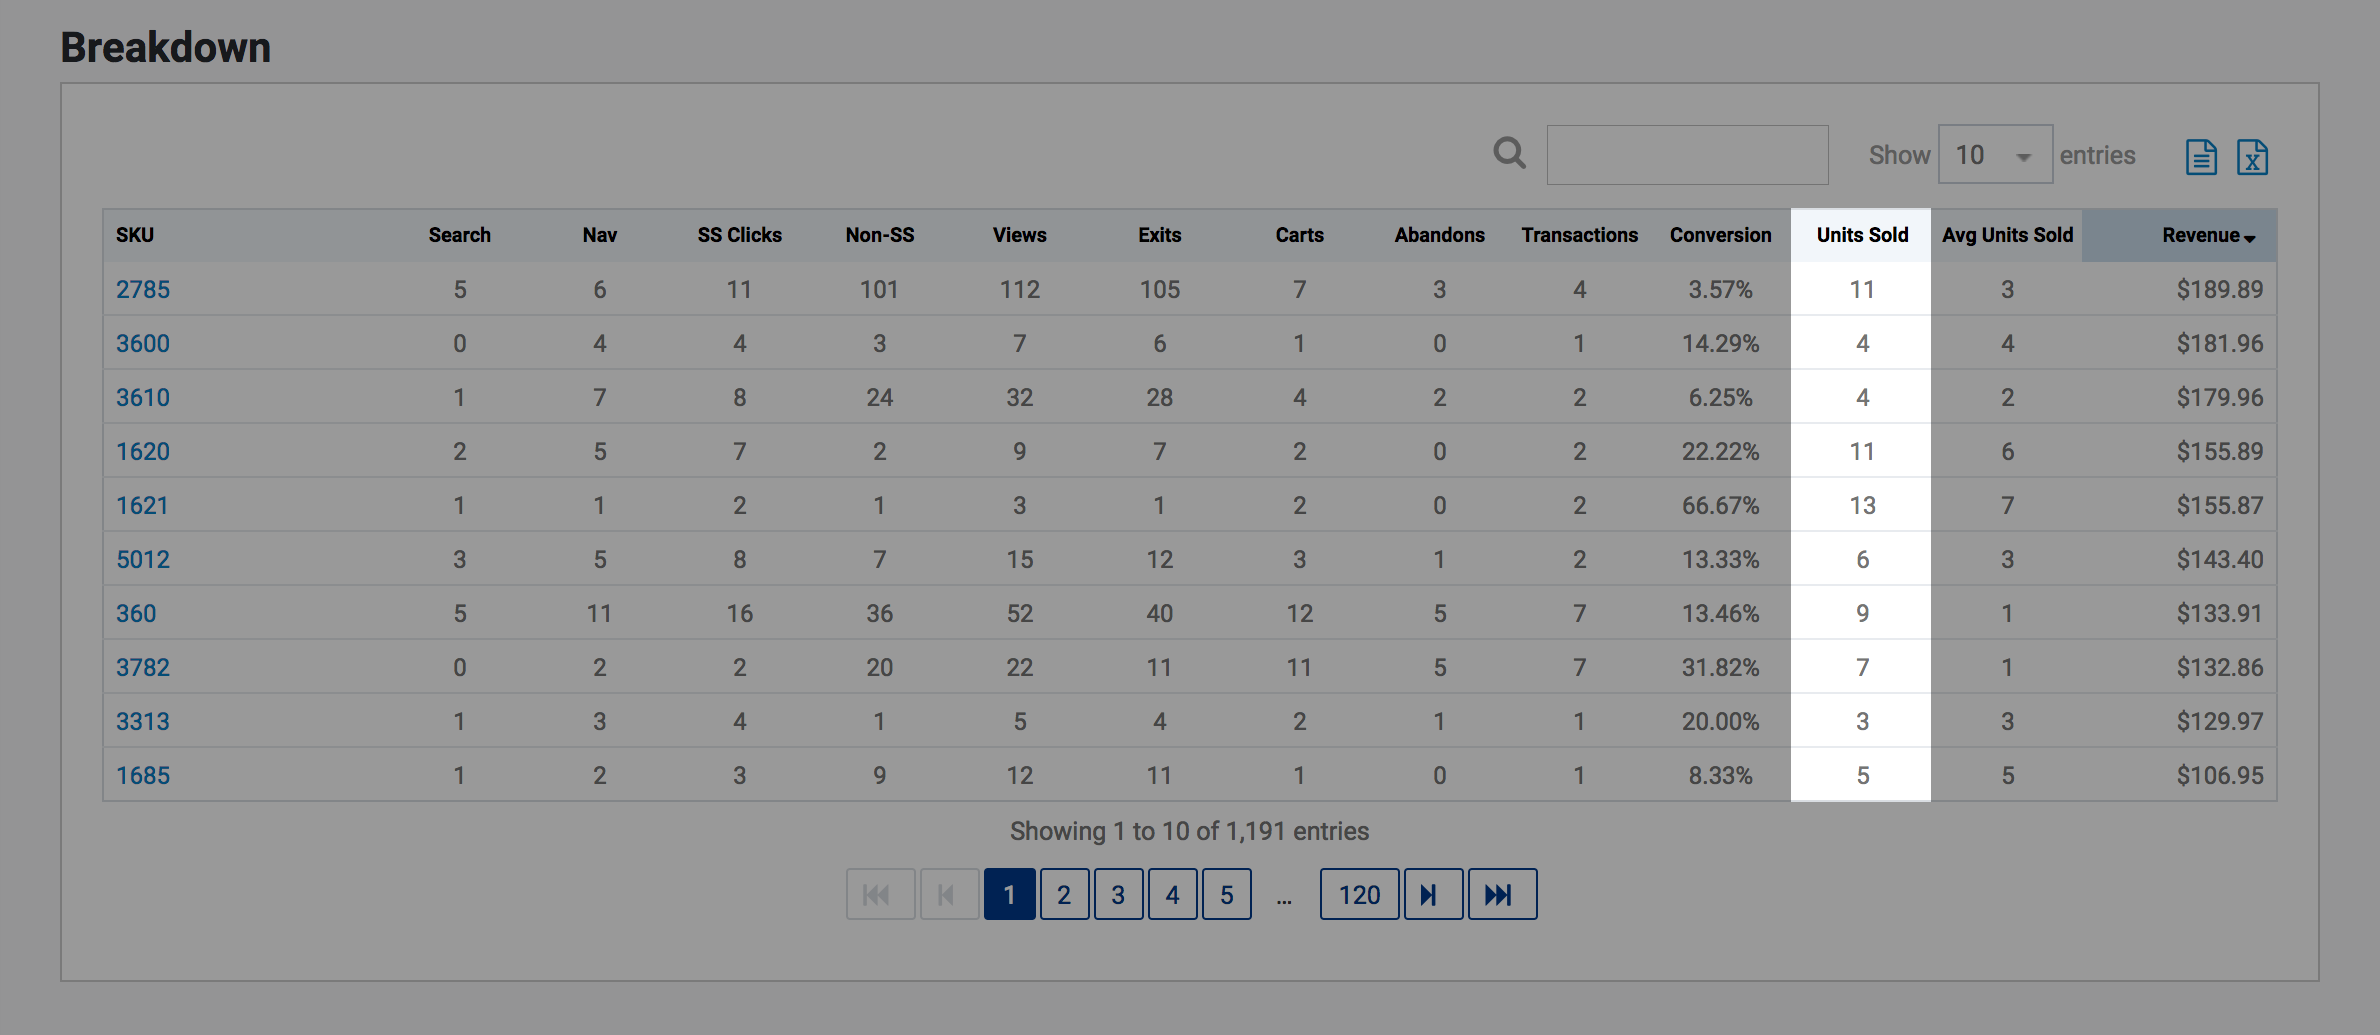
Units Sold
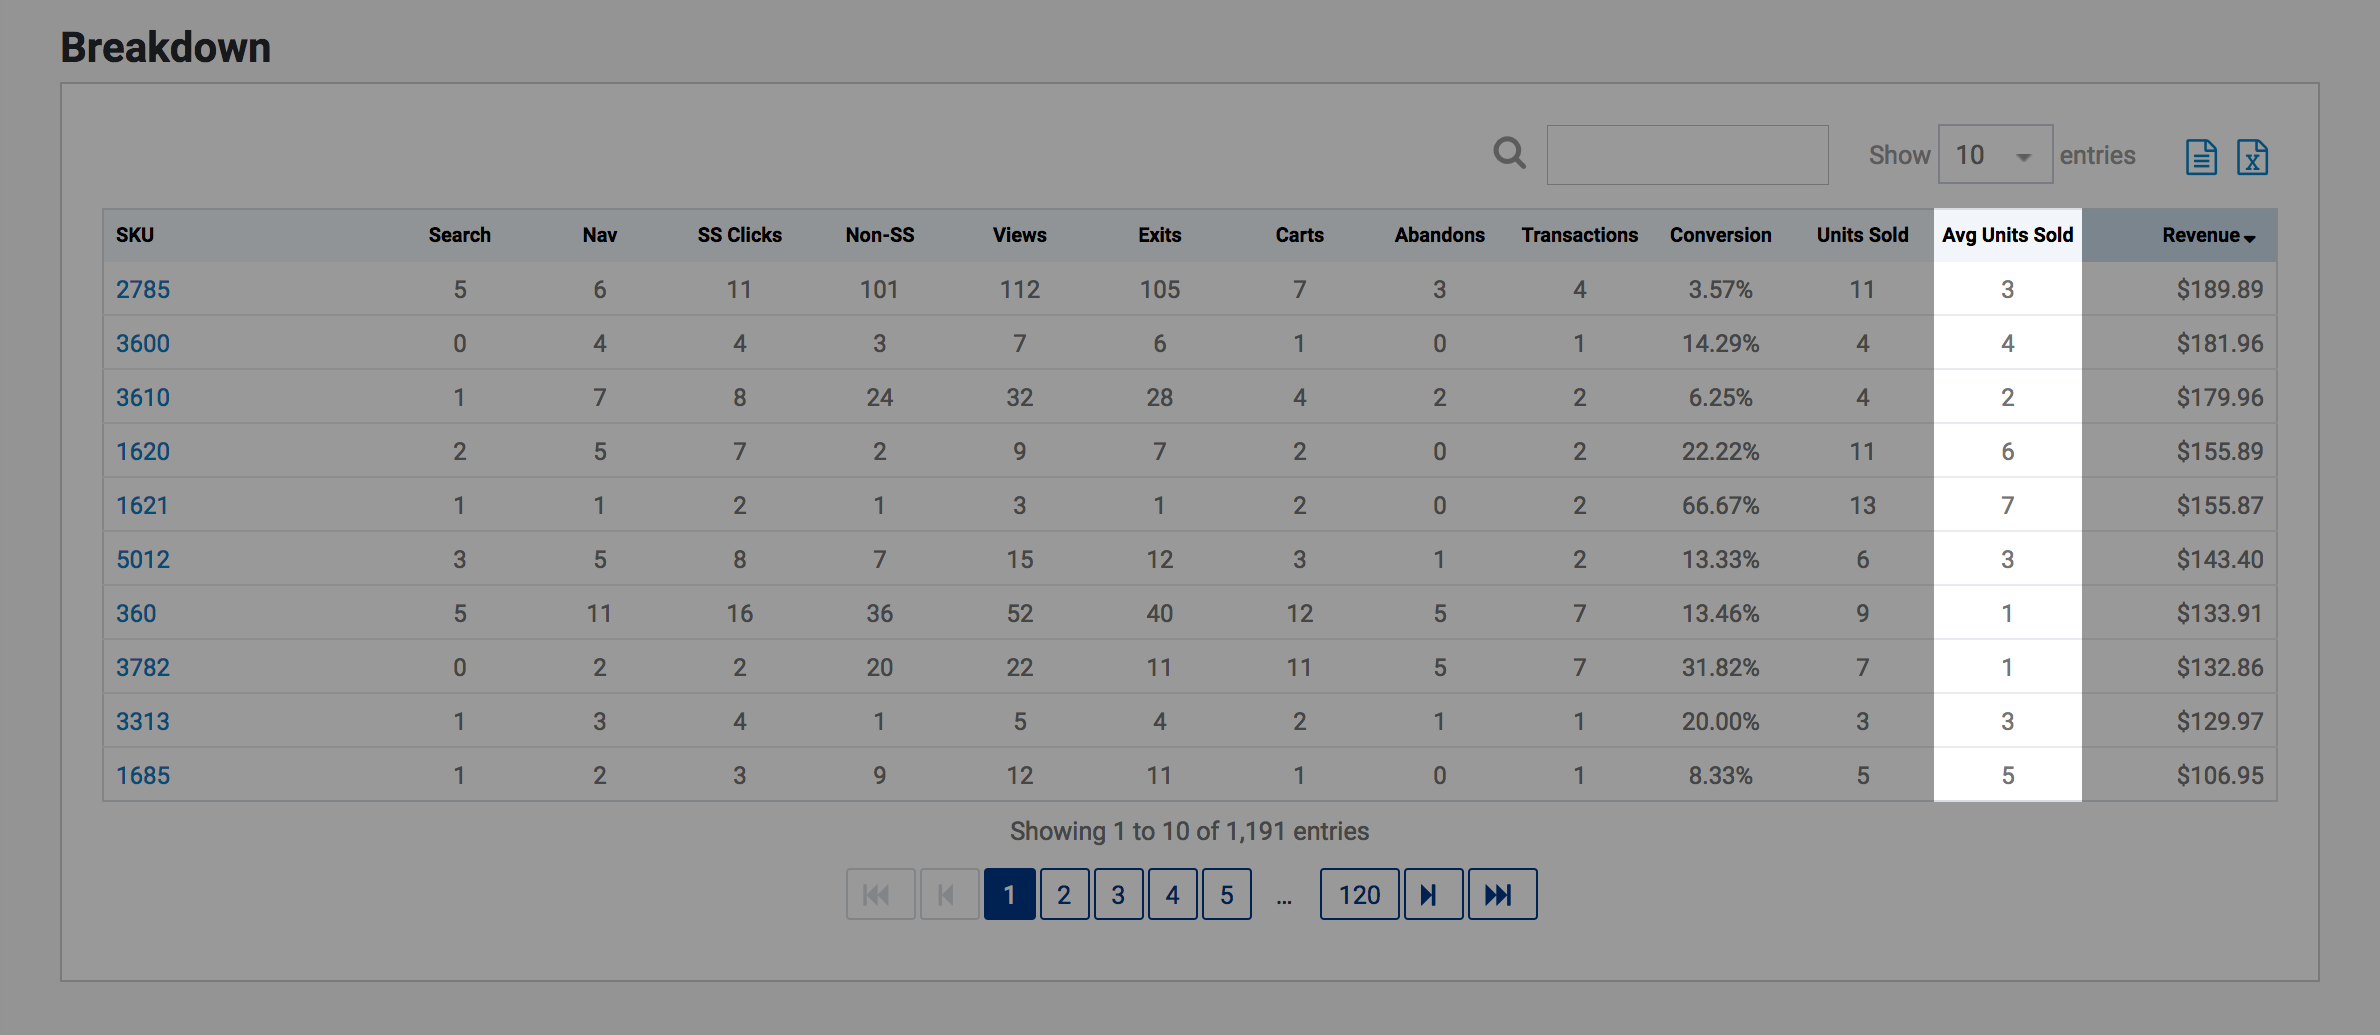
Avg Units Sold
The average number of units sold each time this product is purchased.
Calculation: Units Sold ÷ Transactions
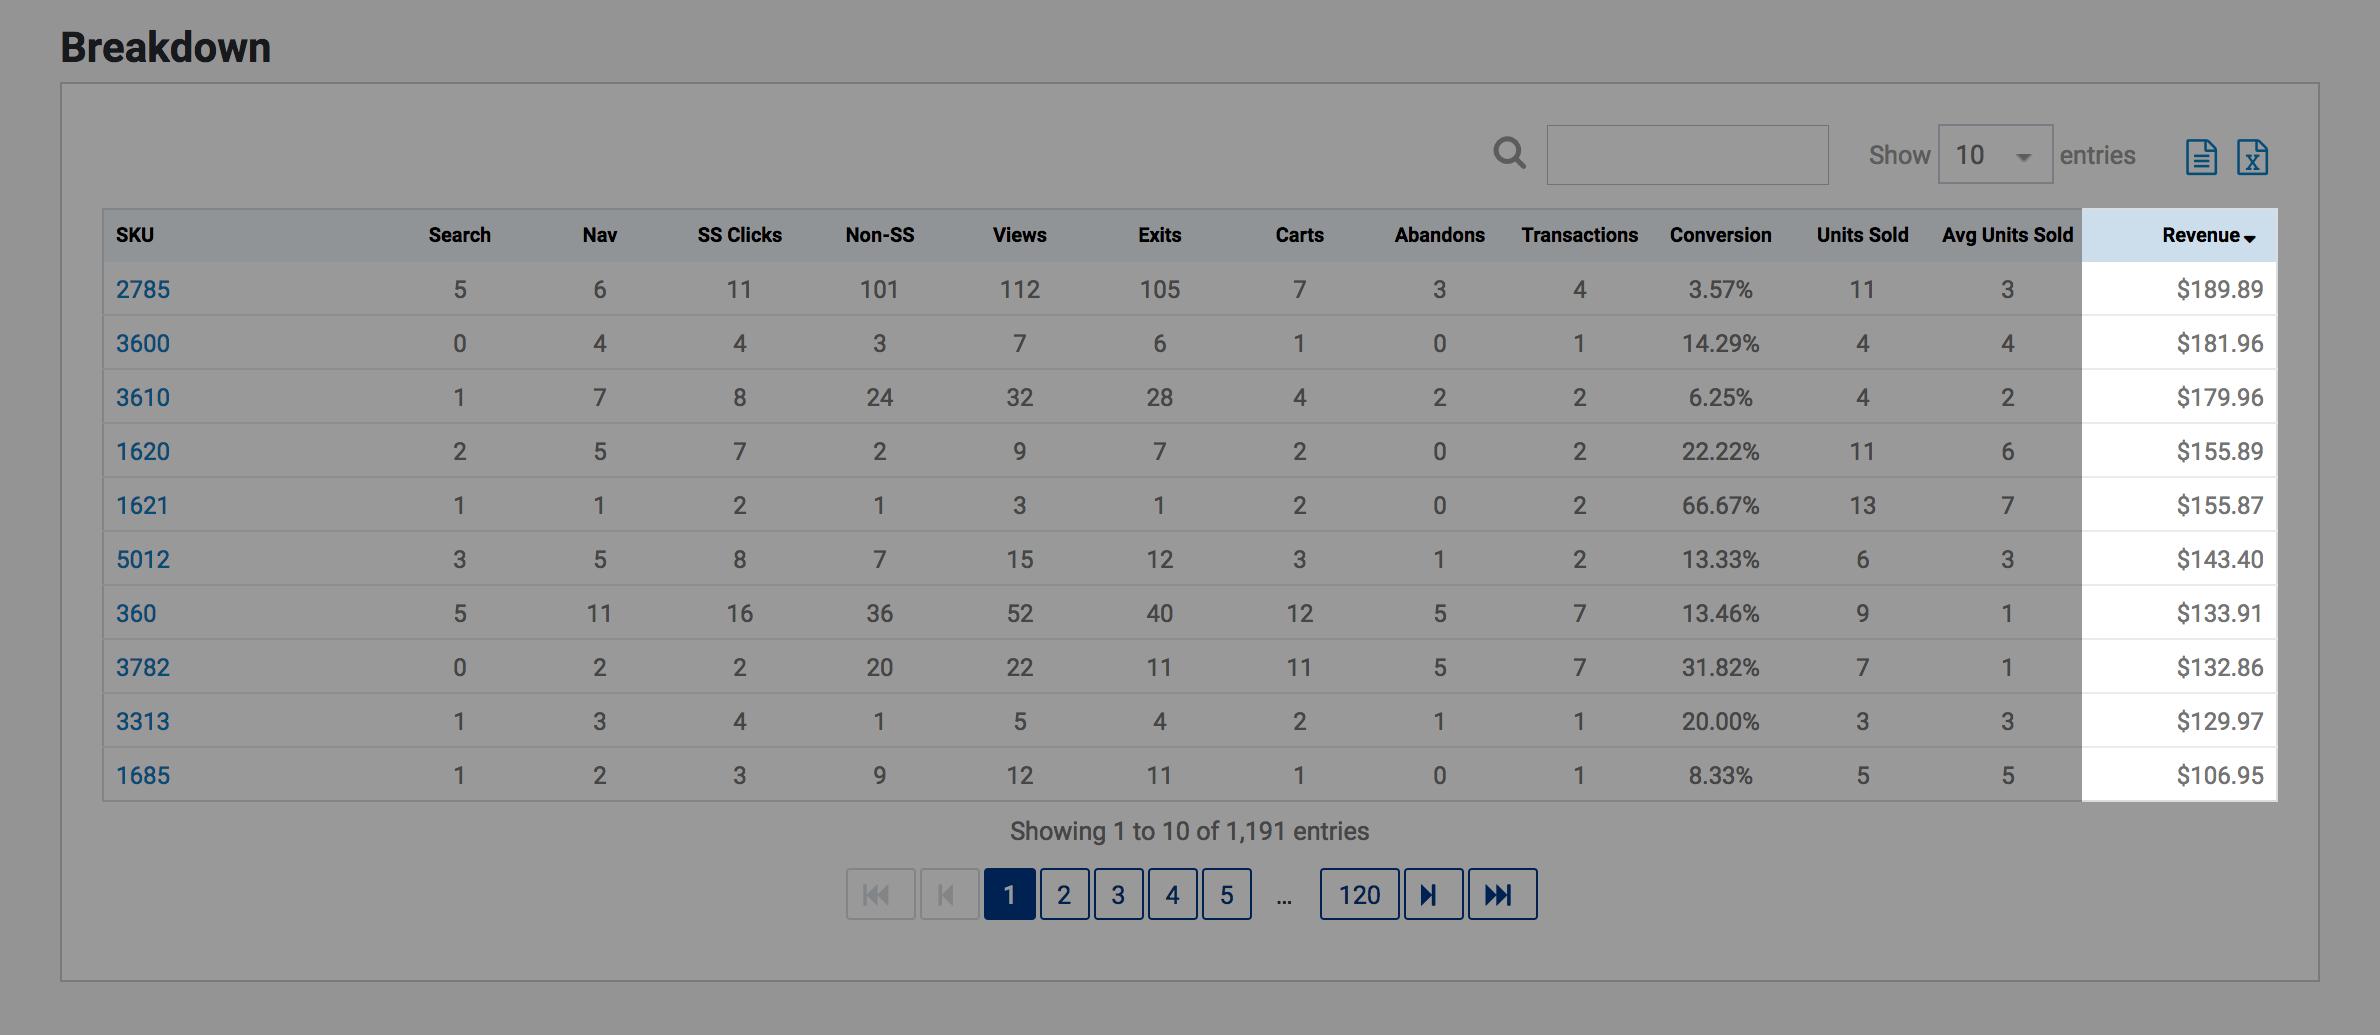
Revenue
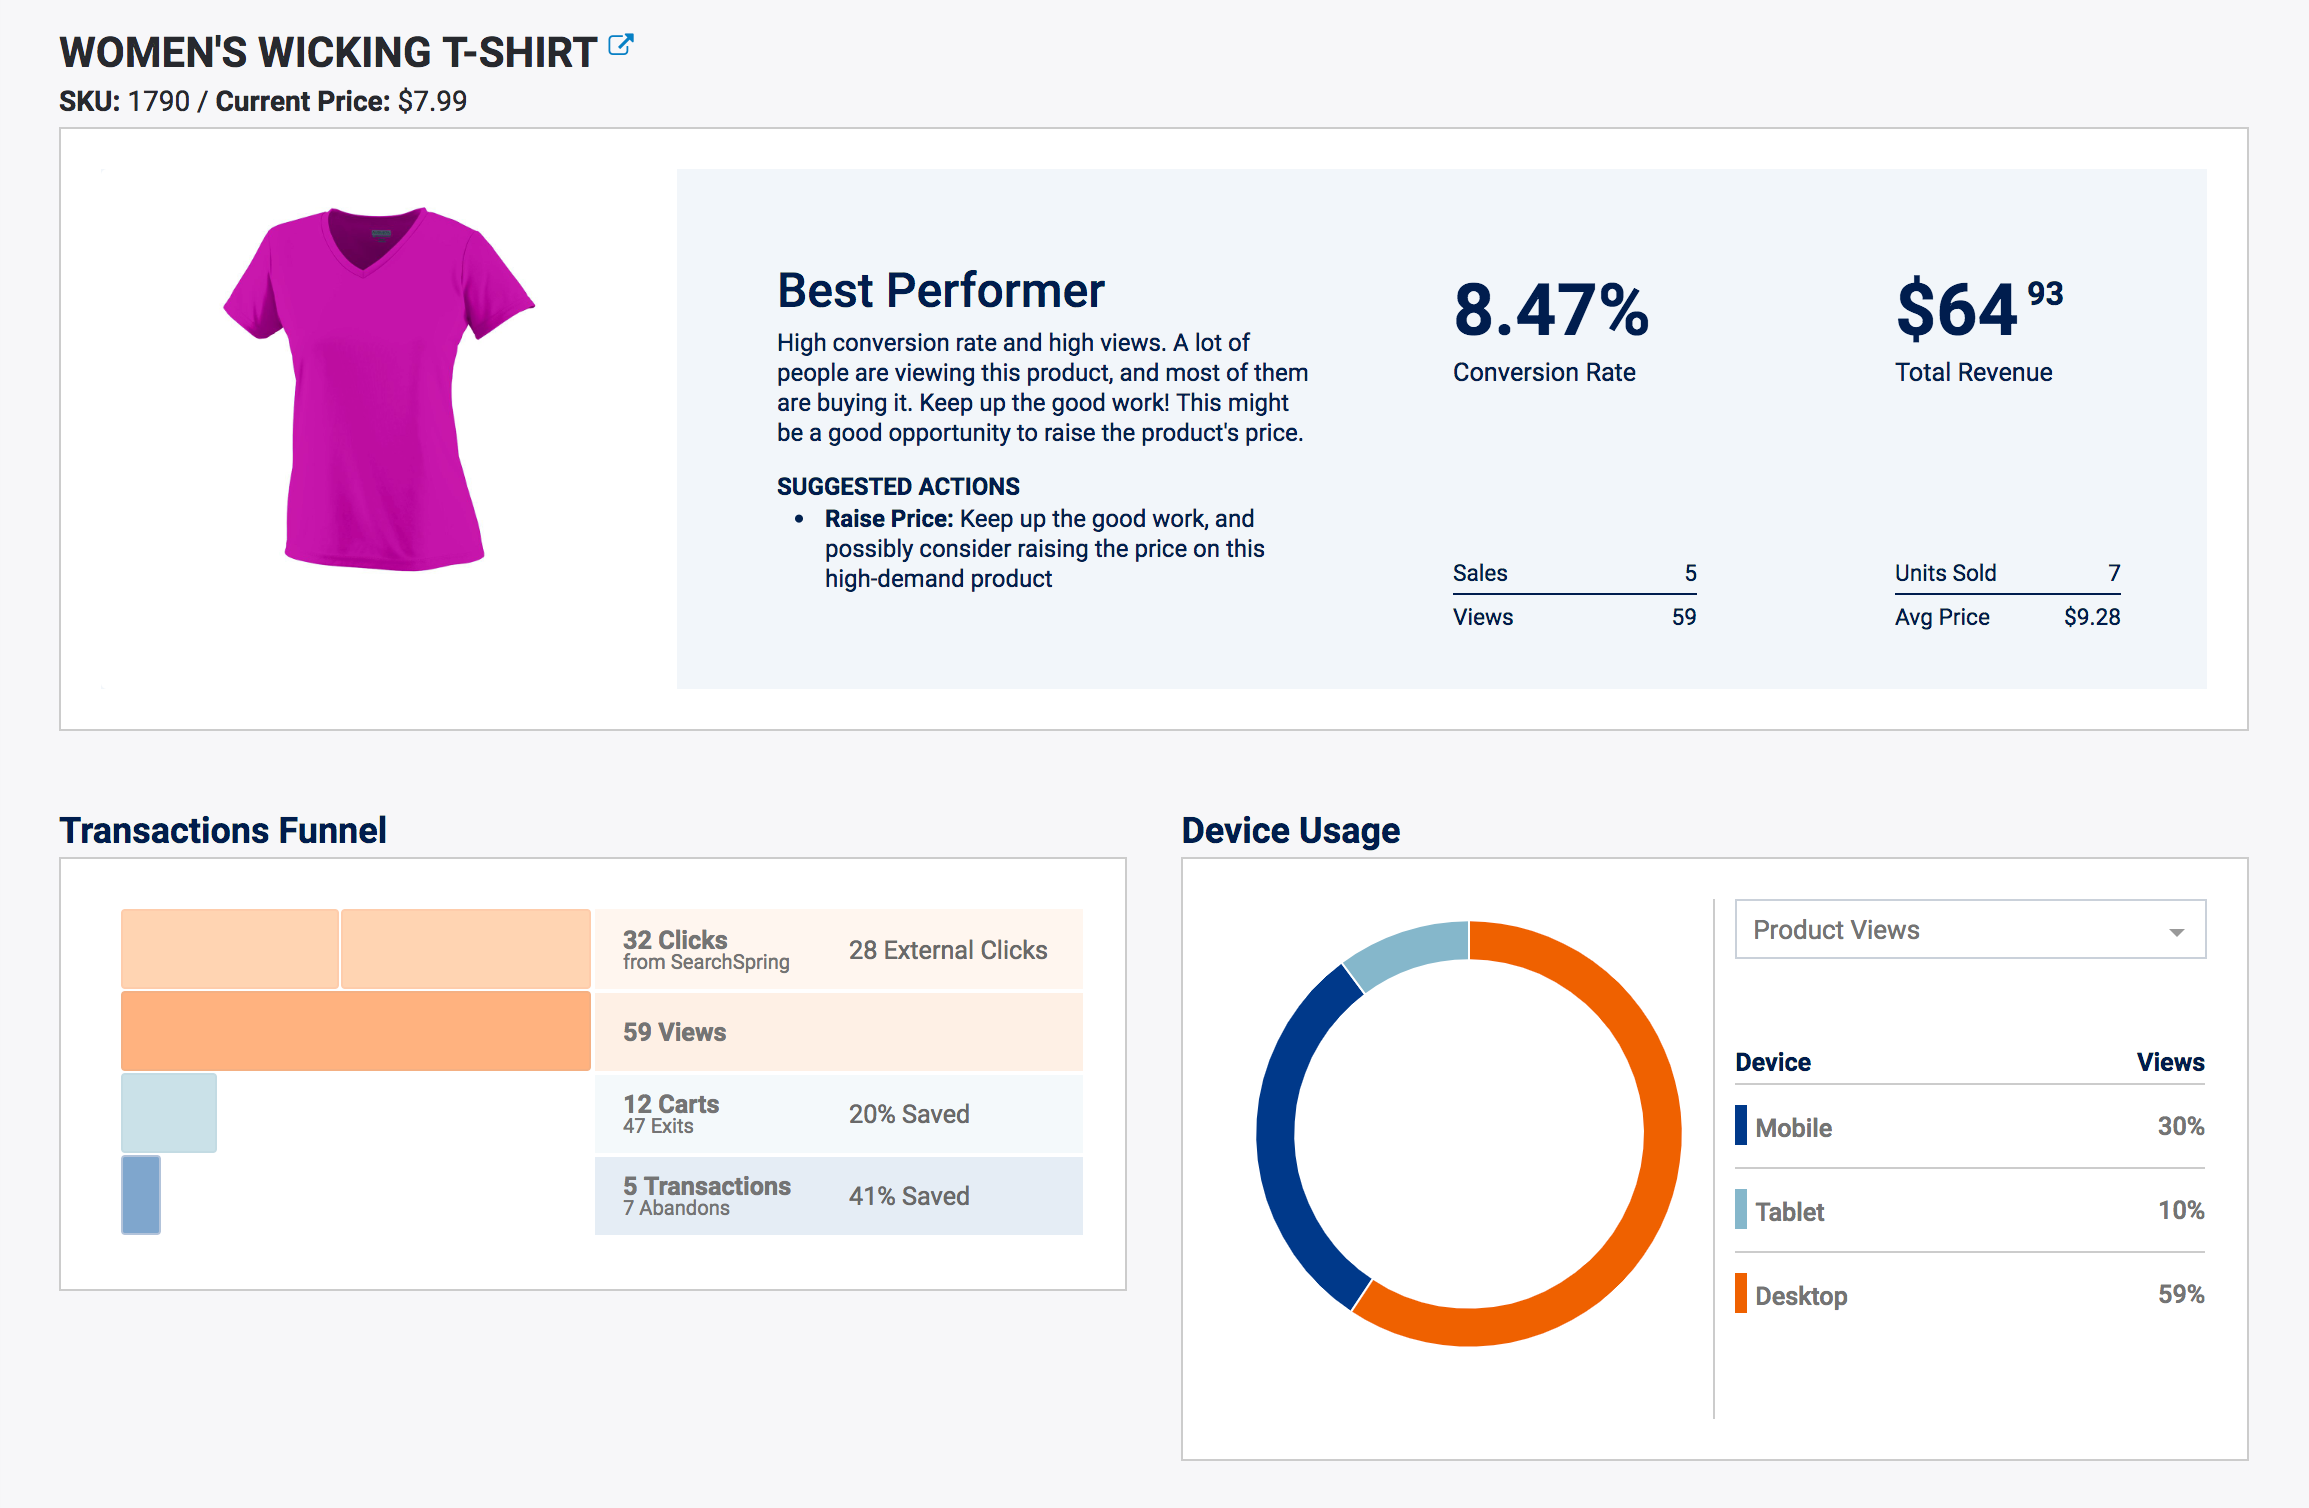
Product Insights Detail Page
The Product Detail page shows an even more advanced breakdown of an individual product’s performance. Click here to learn more about the product insights detail page.


Comments
0 comments
Article is closed for comments.