
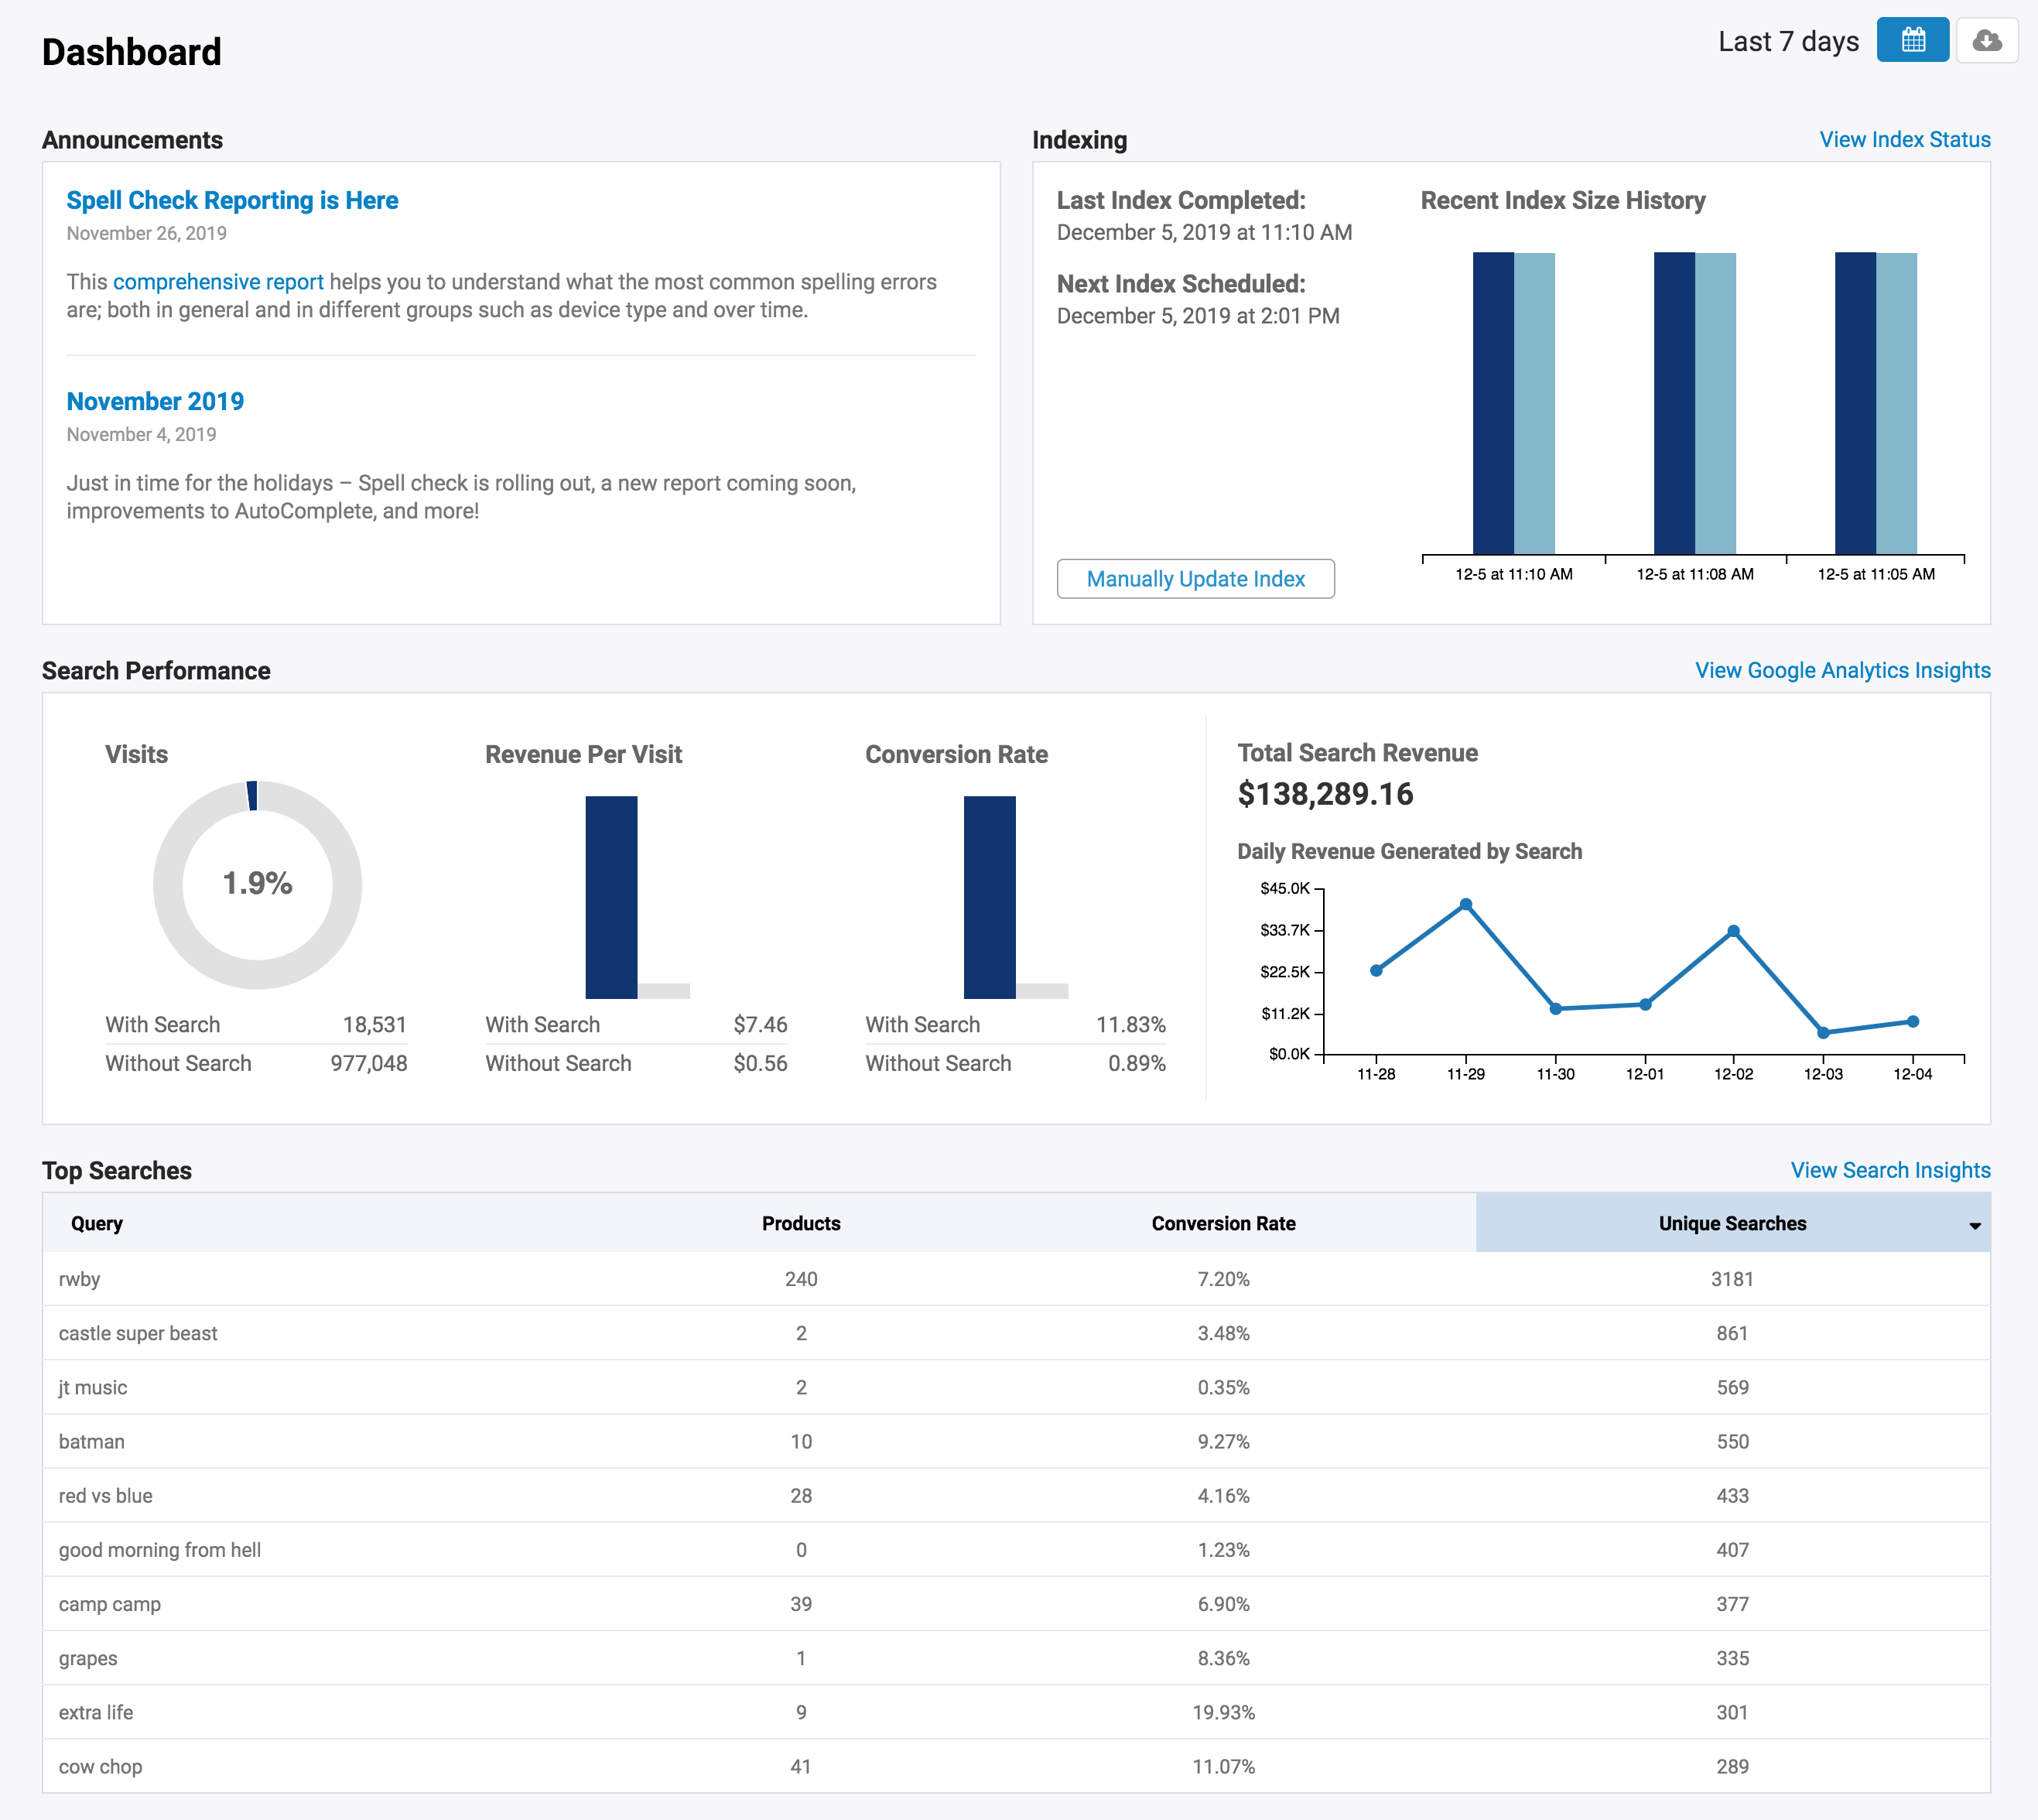
The dashboard is where you first land when logging into the Searchspring Management Console, and provides you with a high level overview of everything you need to know.
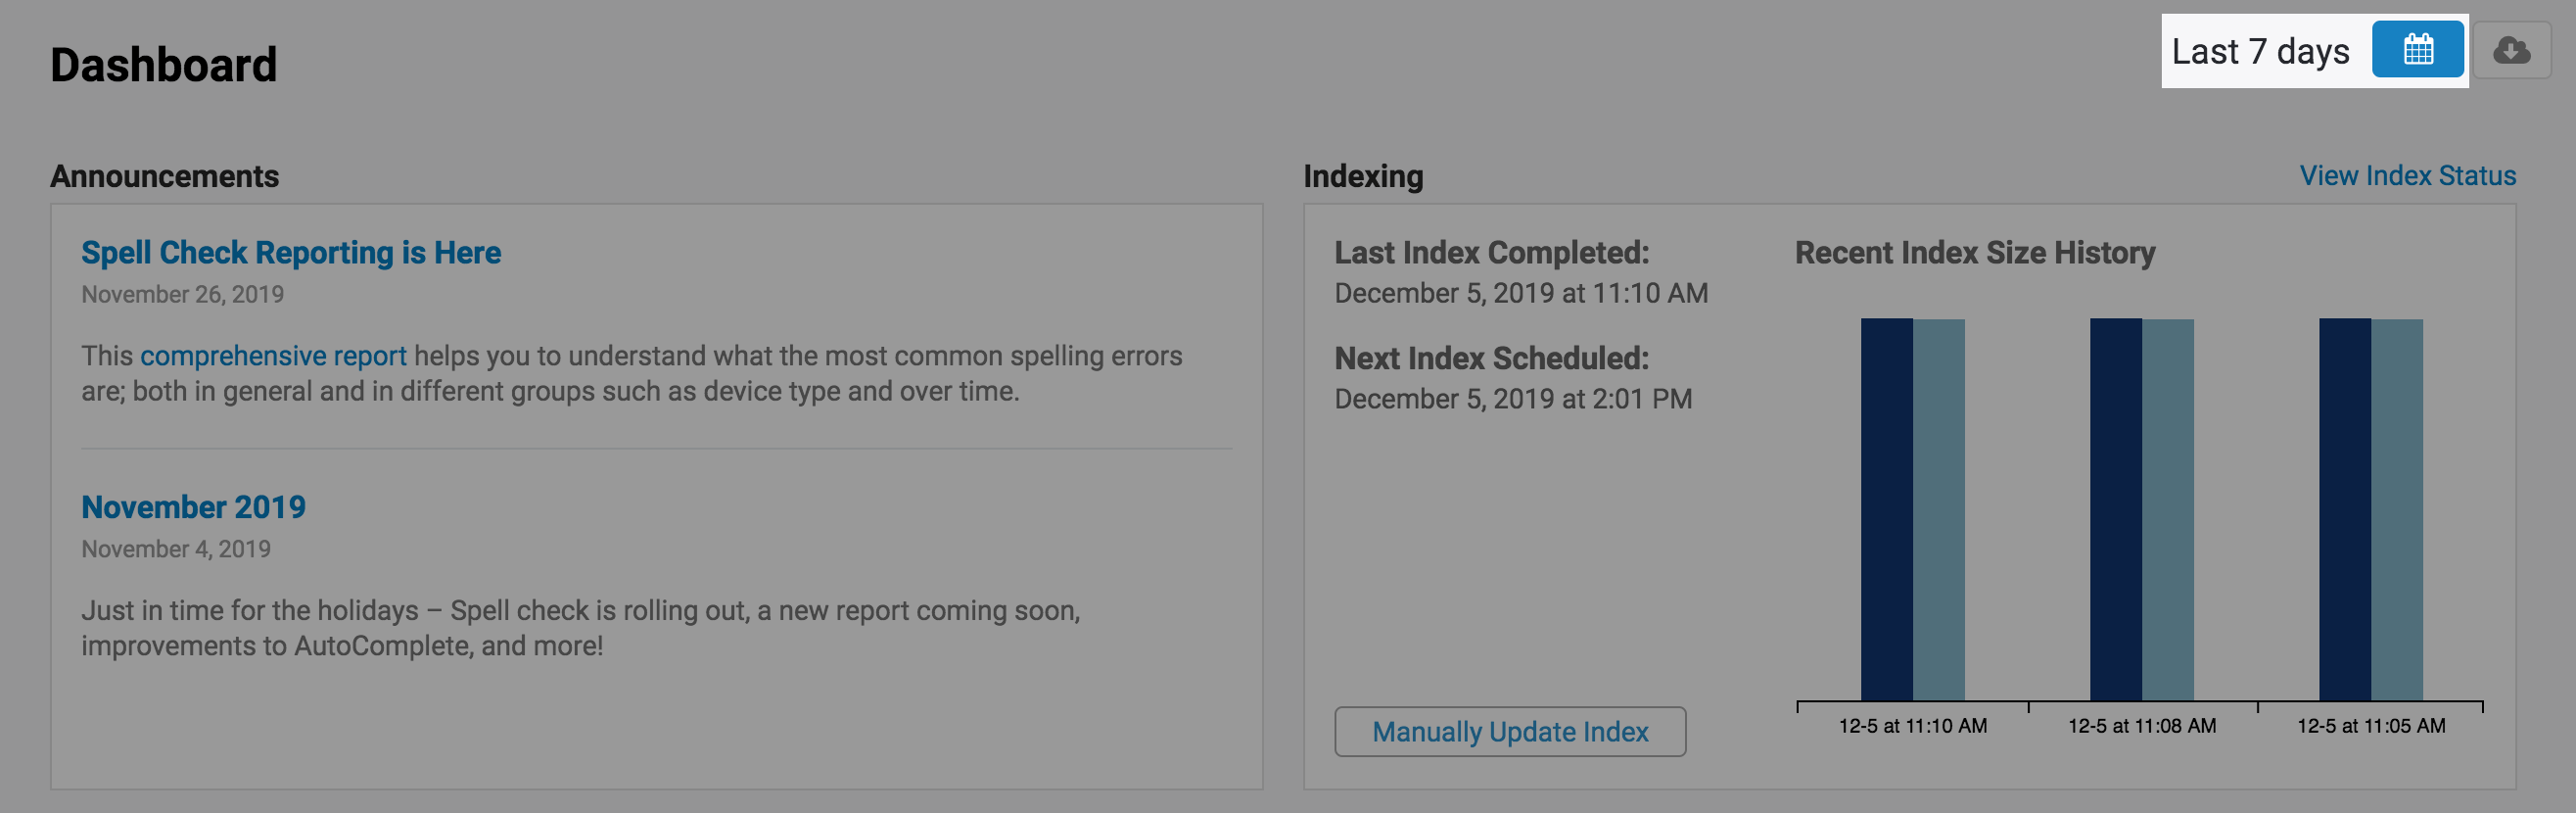
Date Range
All reporting on the dashboard is reflective of what date range has been selected.
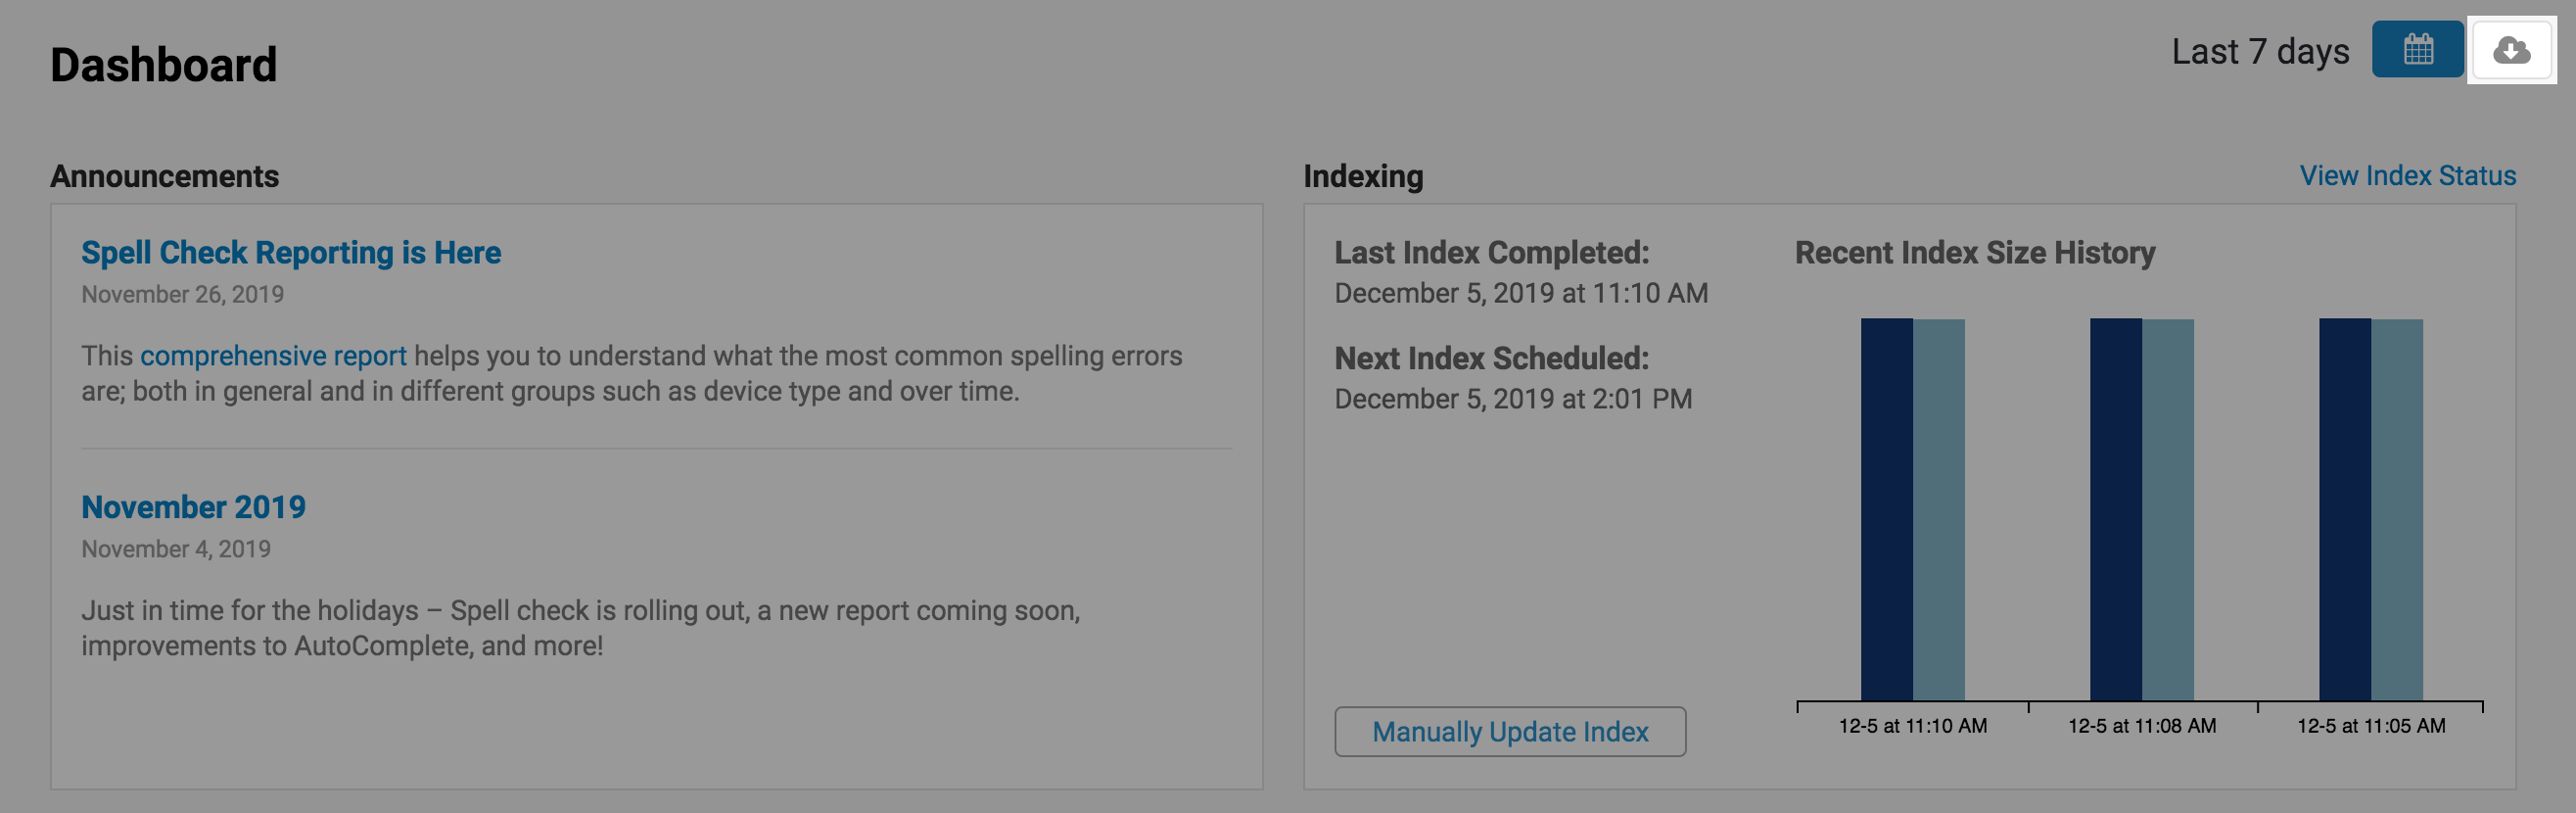
Export PDF
You can create a one-time PDF of the reporting on this page to easily pass off to others or present to coworkers by clicking this button.
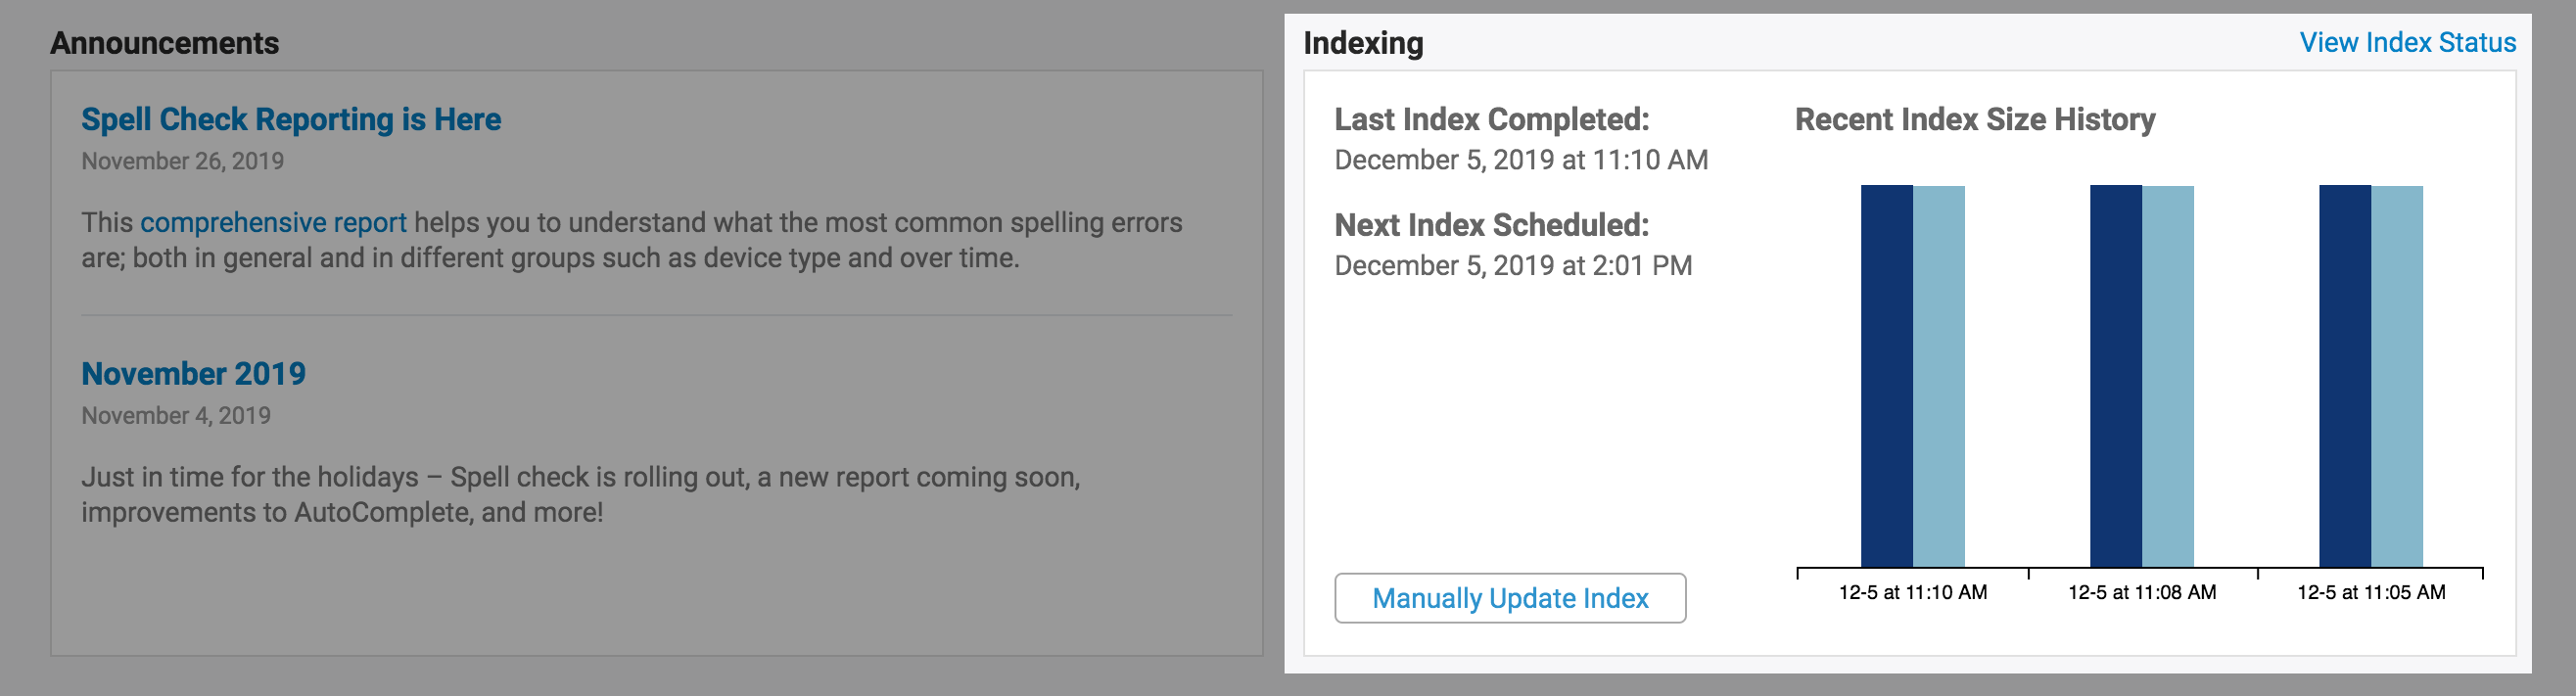
Announcements
Recent updates and announcements will conveniently appear right here.
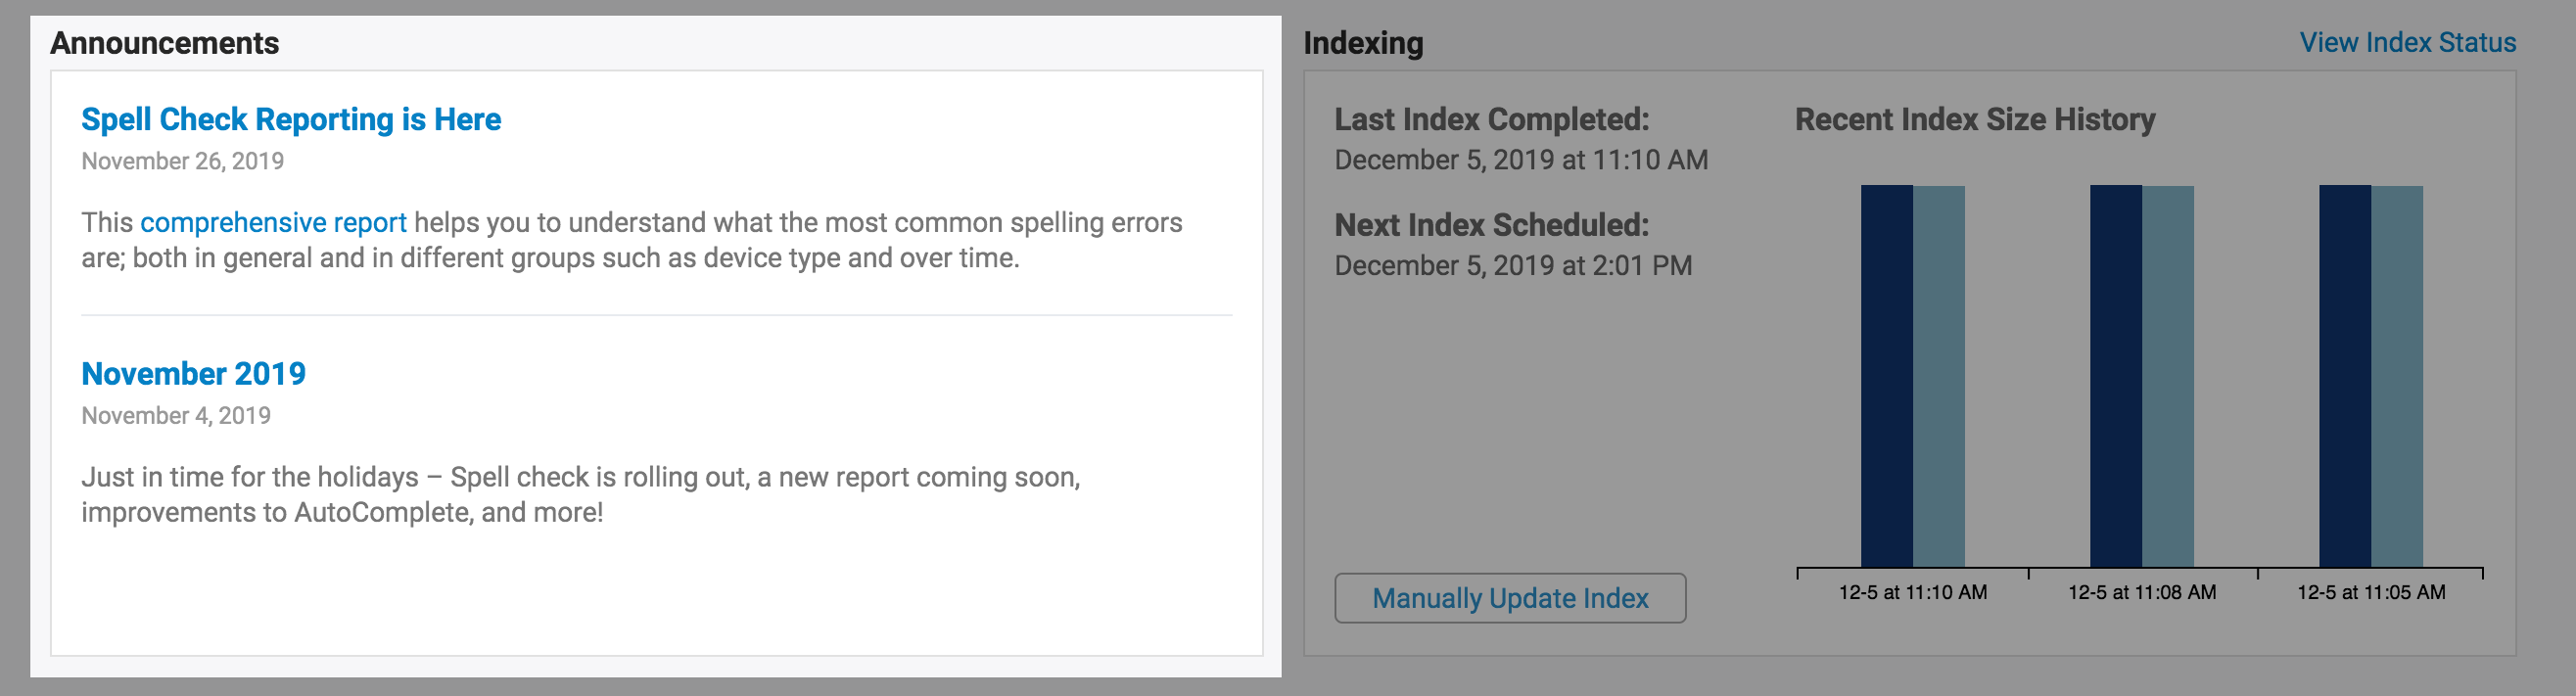
Indexing
Get a quick glance of your most recent data sync-ups with Searchspring by reviewing your site's Indexing status overview here.
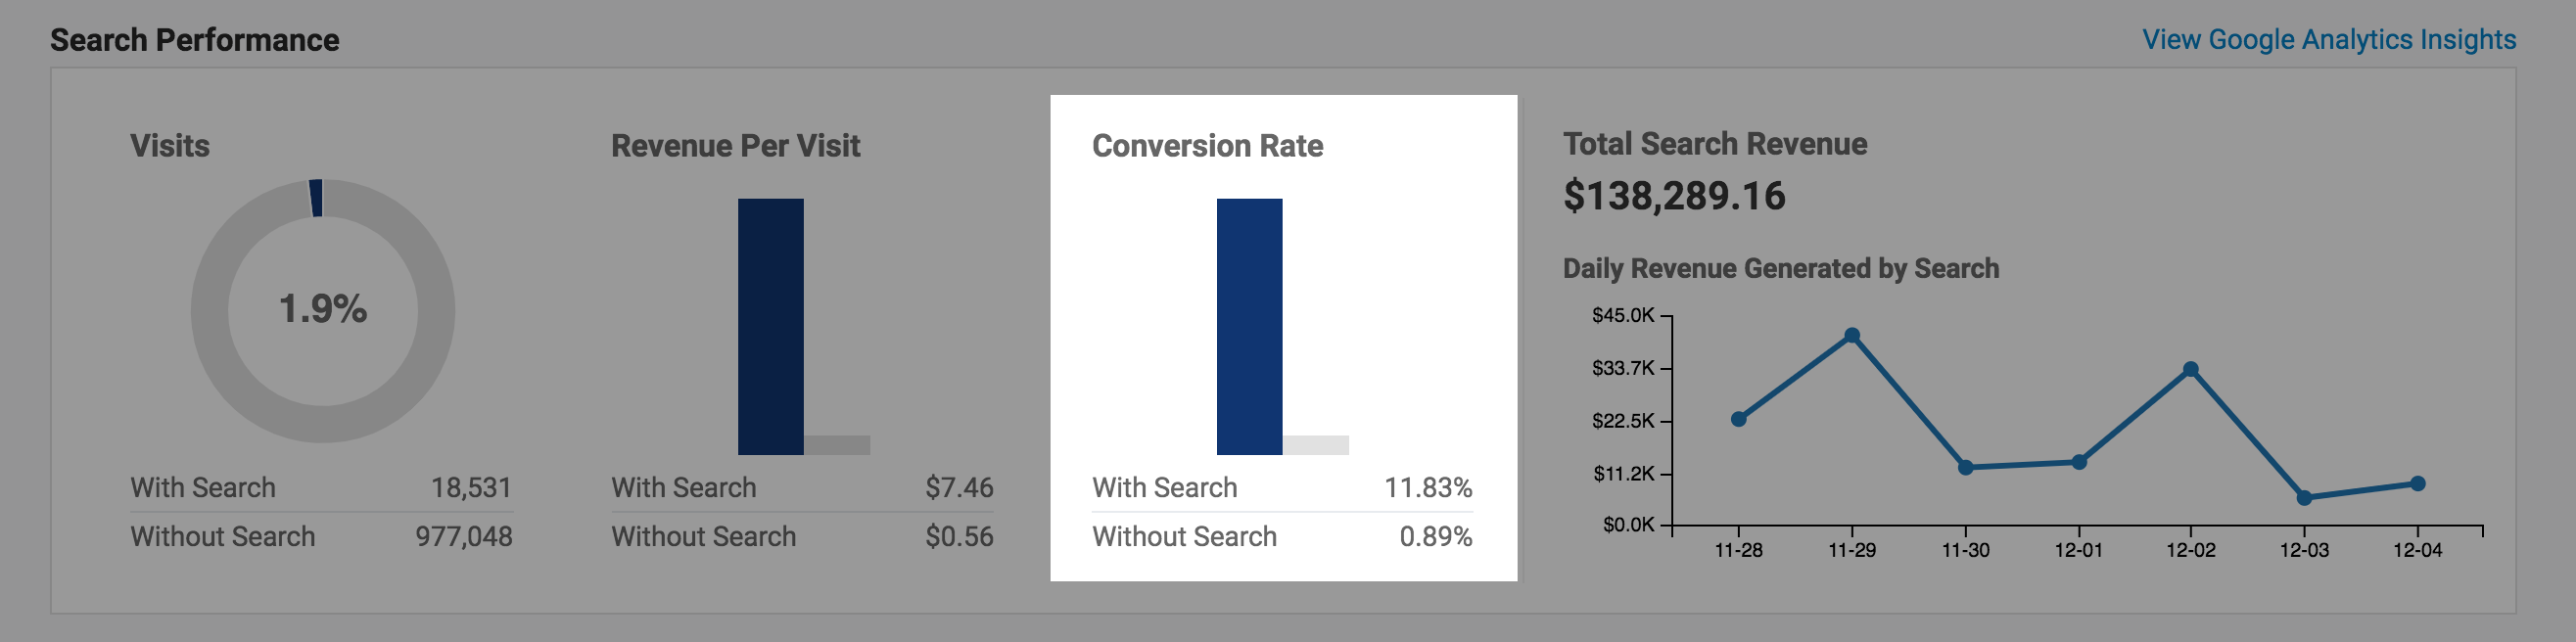
Search Performance
How is search performing on your site? This snapshot shows you the impact that searching users really make on your site.
This is powered by Google Analytics Insights, and will require you to connect your account before it will appear.
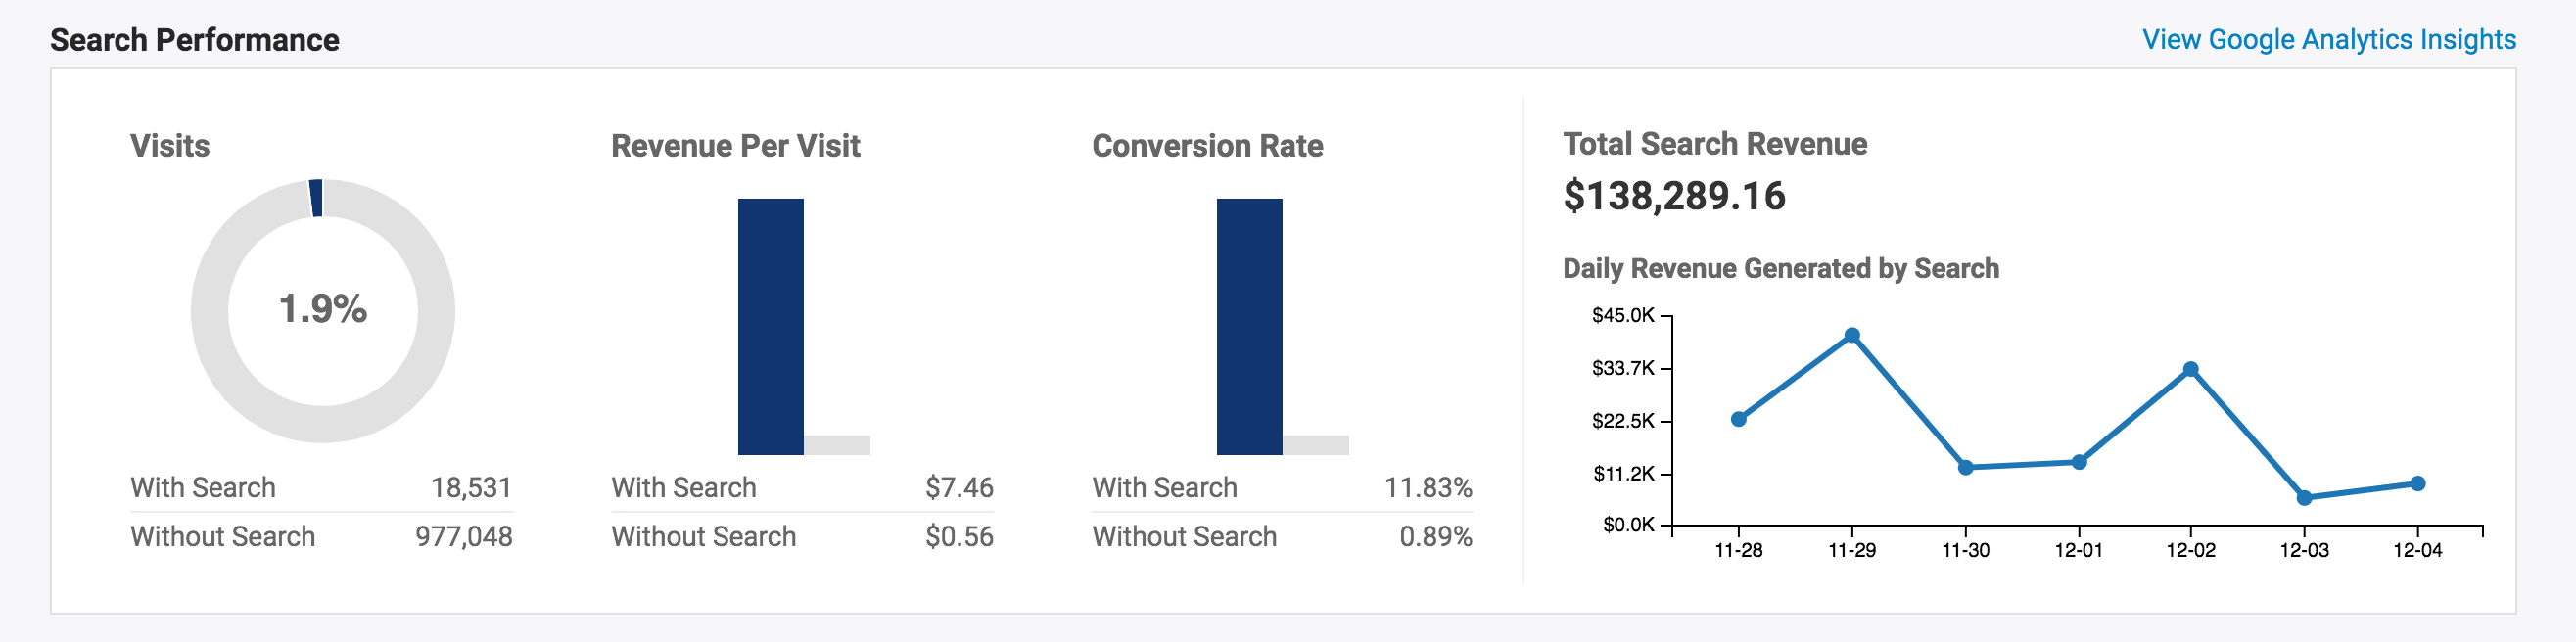
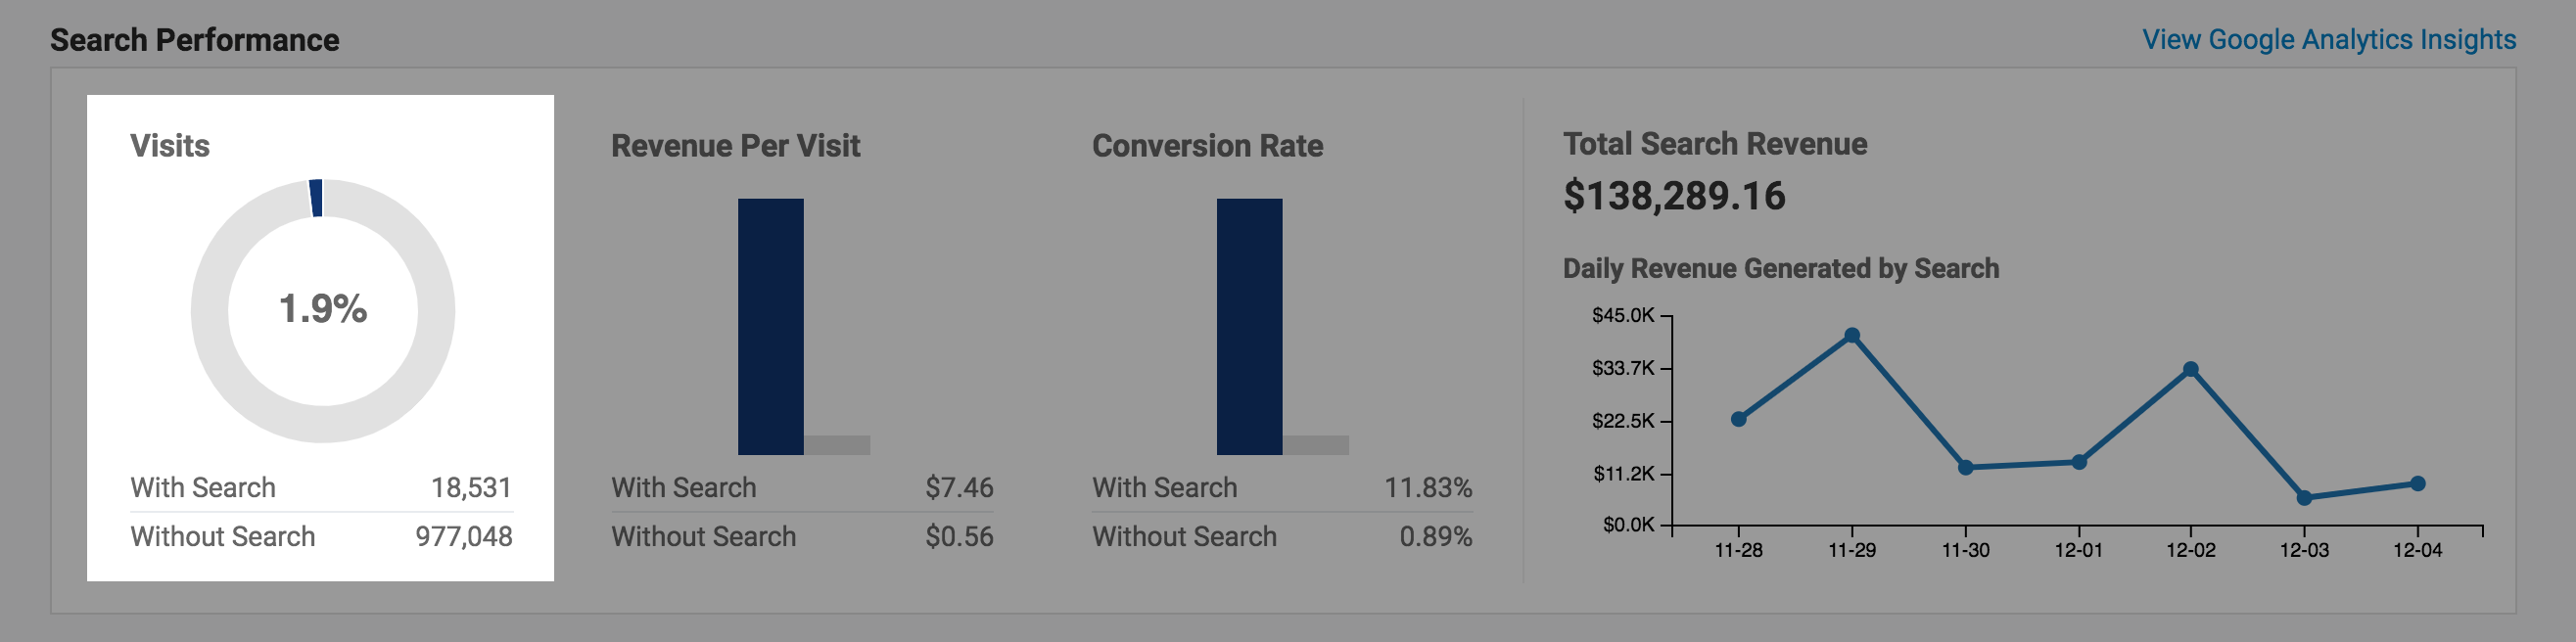
Visits
This segment can be used to give you an idea of how often your shoppers use site search during their visits (or "Sessions") on your site. The numbers below the chart show a breakdown of the number of sessions where shoppers used site search, and how many sessions where they did not.
Calculation: Sessions where search was used / Total sessions
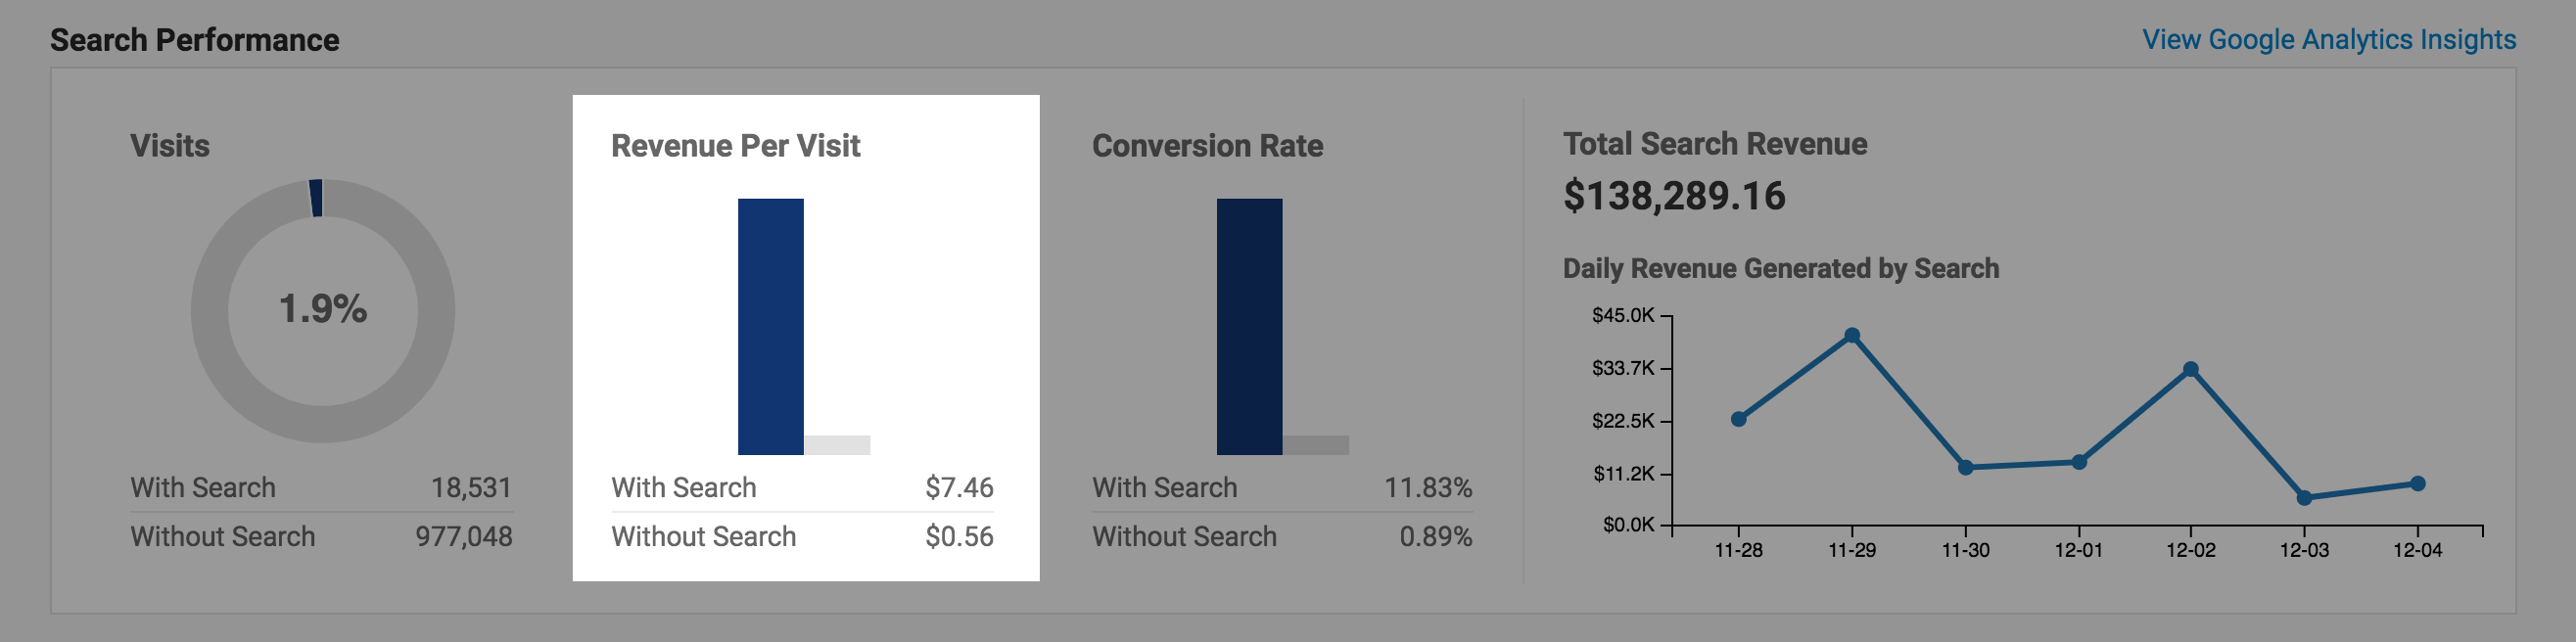
Revenue Per Visit
This segment shows a breakdown of how Per Session Value (calculated as Revenue / Sessions) compares the revenue to visitor ratio between shoppers who use search and those who don't. You can use this metric to determine the overall value of visitors who use search. A higher ratio number indicates a combined higher likelihood of searching customers to convert and/or spend more when they visit your store.
Calculation: Per Session Value (with search) / Per Session Value (without search)
Conversion Rate
This segment shows a breakdown of how Conversion (calculated as Transactions / Sessions) compares among shoppers who use search, and those who don't. This metric can be used to give you an idea of how likely searching customers are to complete a transaction after performing a search.
Calculation: Conversion (with search) / Conversion (without search)
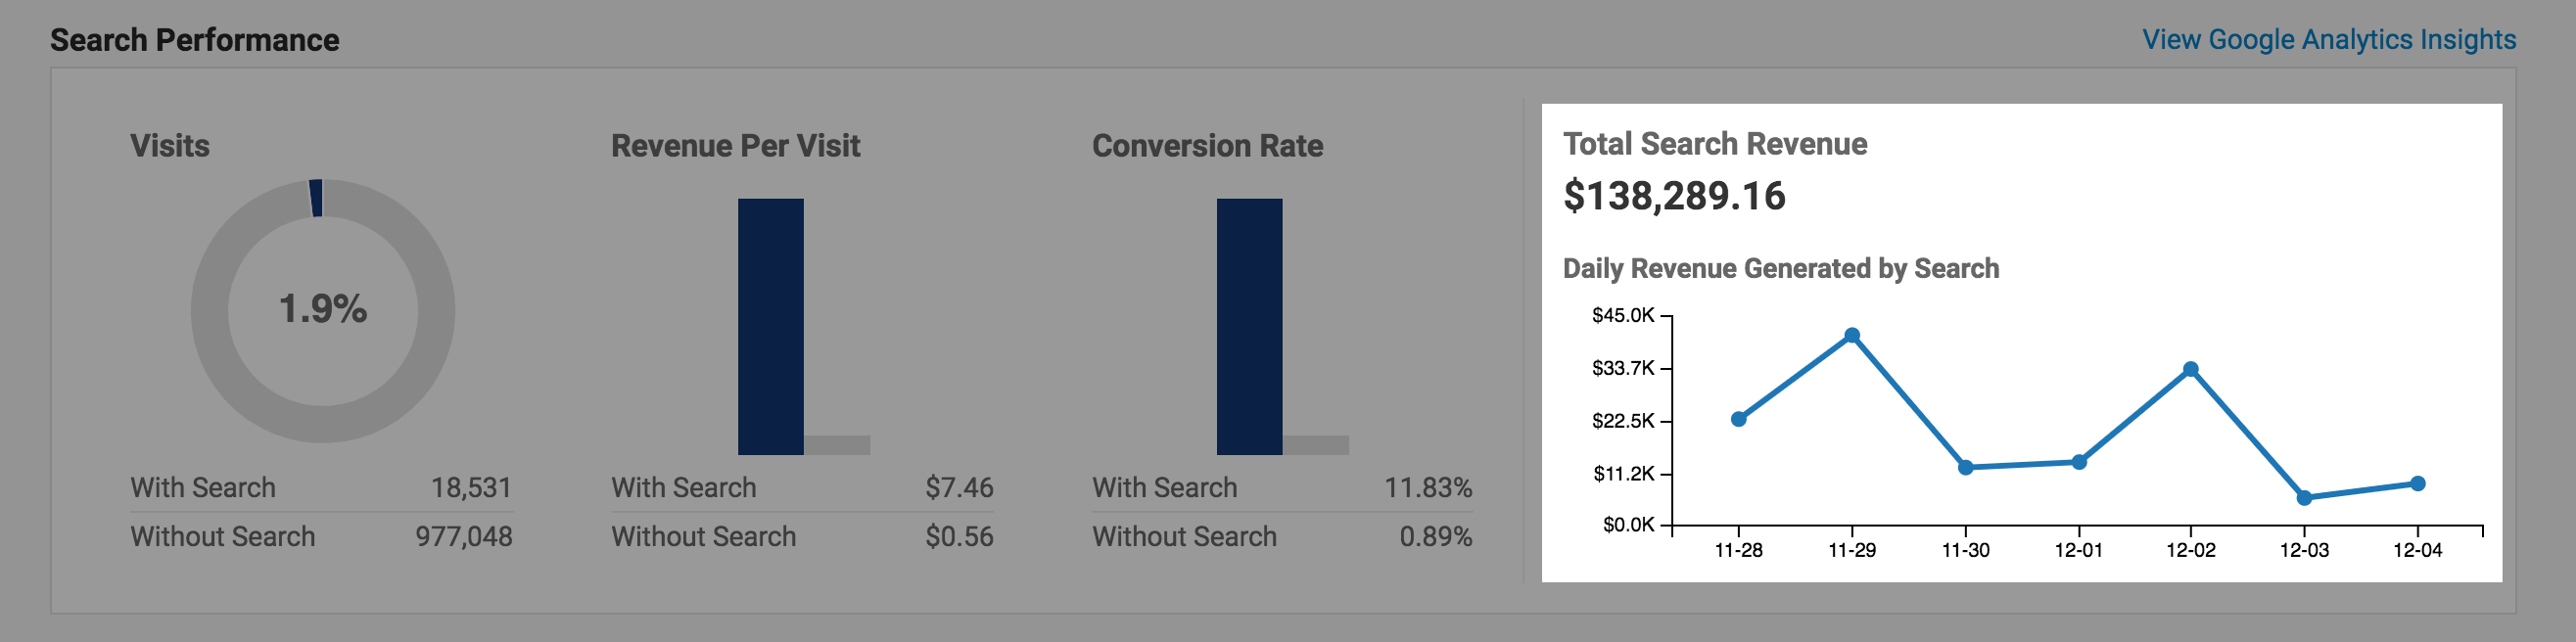
Search Revenue
This chart shows you a day-by-day breakdown showing you how much revenue was made on your site by shoppers who used search before completing a transaction.
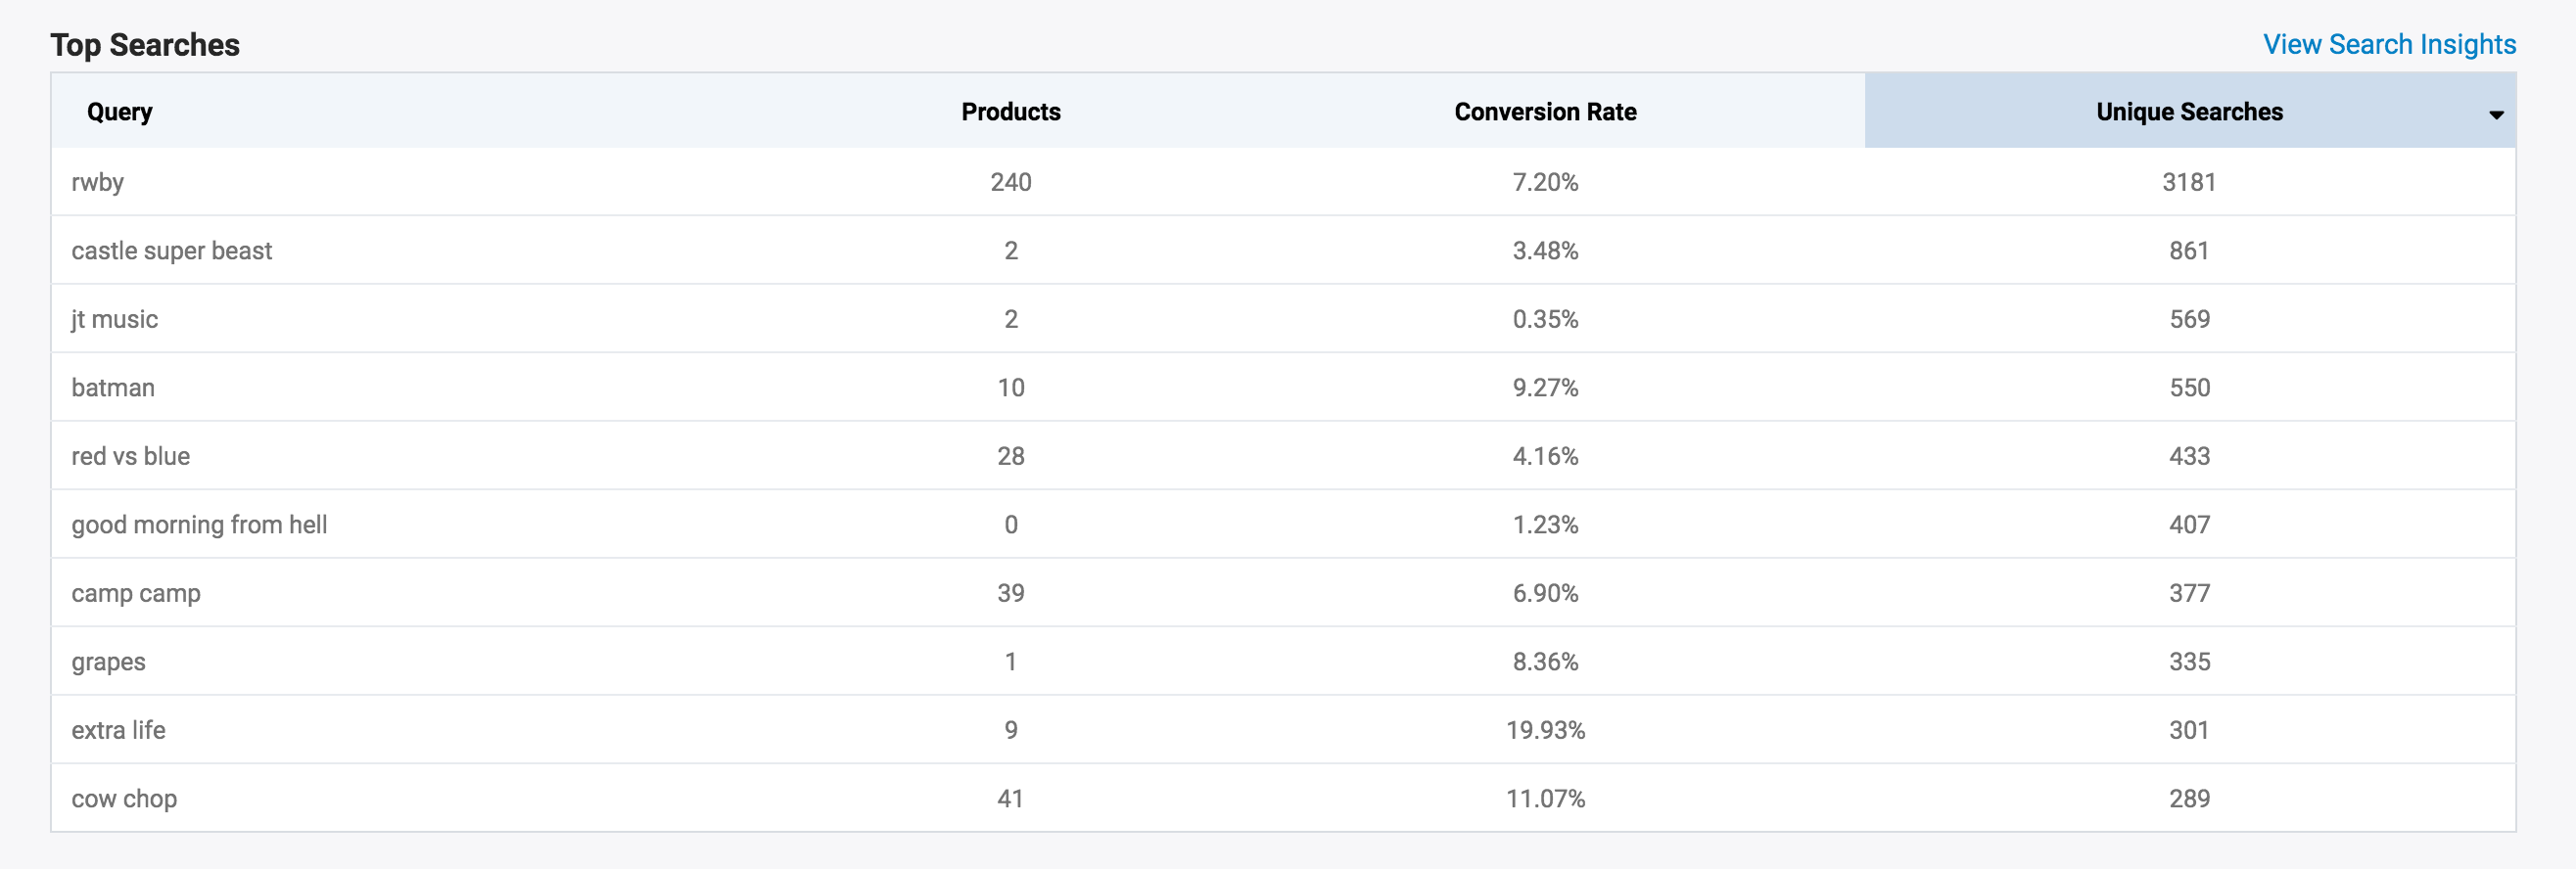
Top Searches
Shows how many searches occur on your store, breaking down how popular each query is. This report is a valuable way to see what your shoppers are looking for.
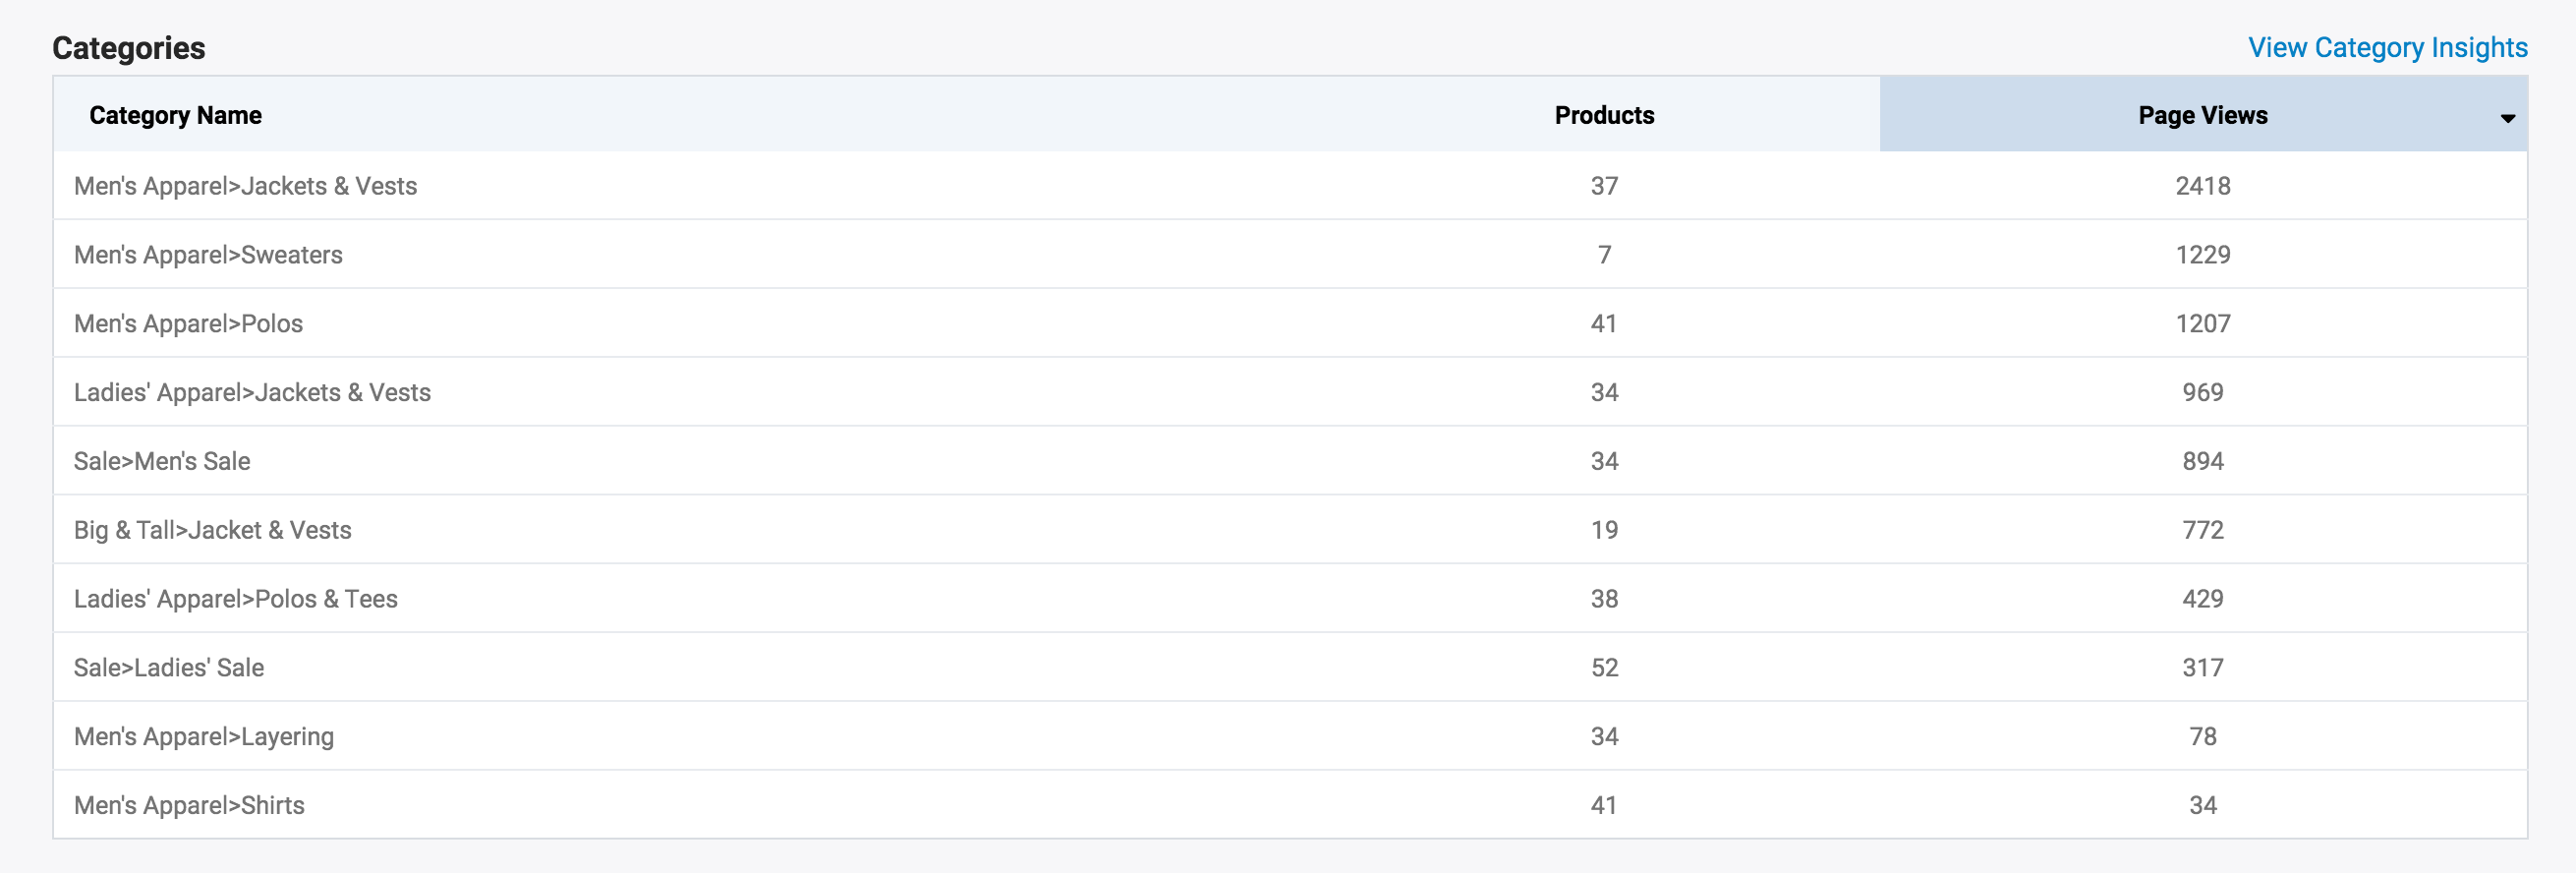
Categories
Category Insights utilizes both Searchspring and Google Analytics data to present important metrics breakdowns for each Searchspring Category integration on your site. You can use this report to analyze how shoppers are interacting with the various Searchspring-powered category pages on your site, and you can take action directly from this report.
Top Spell Corrections
Spelling Correction has some great affects on helping your customers while searching on your store. This report helps you to understand what the most common spelling errors are, both in general and in different groups such as device type and over time.
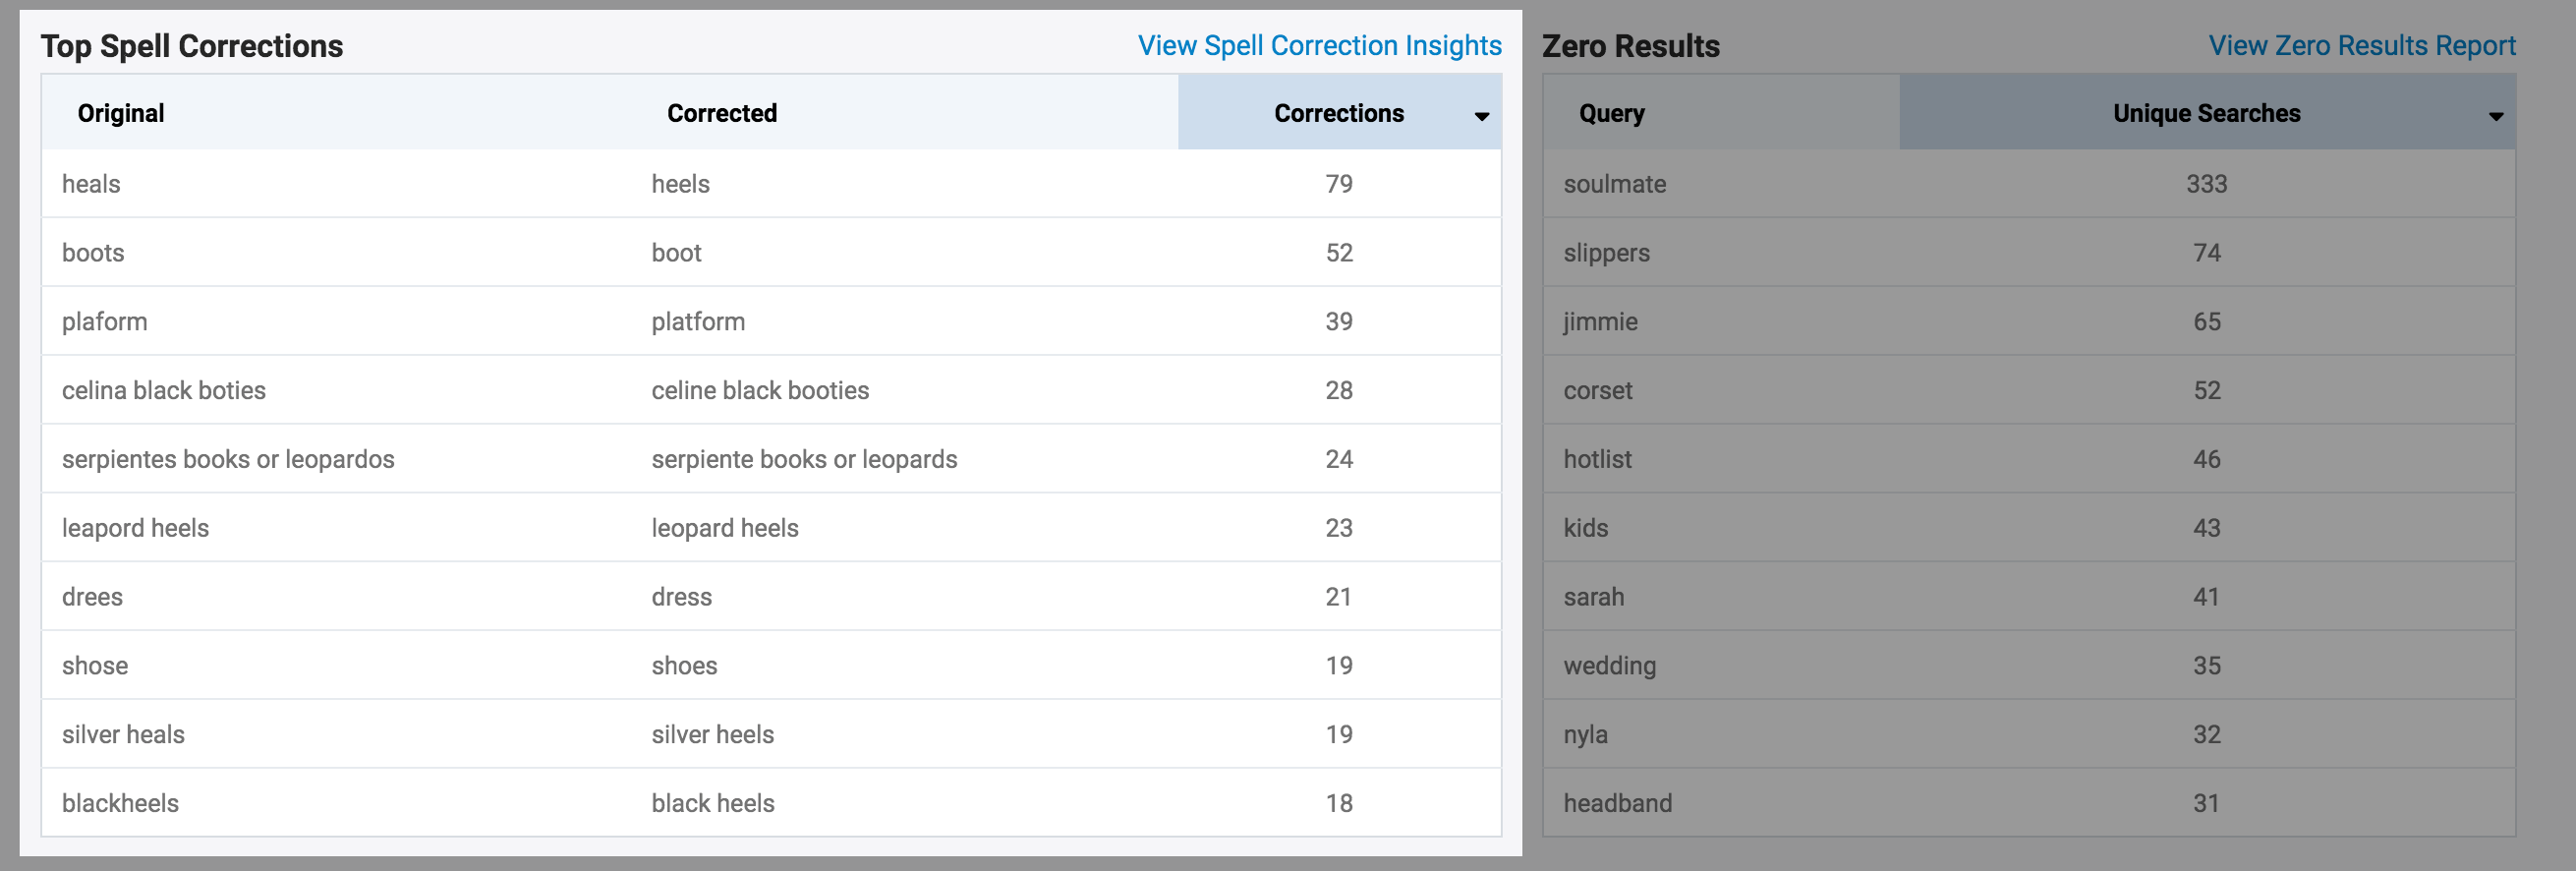
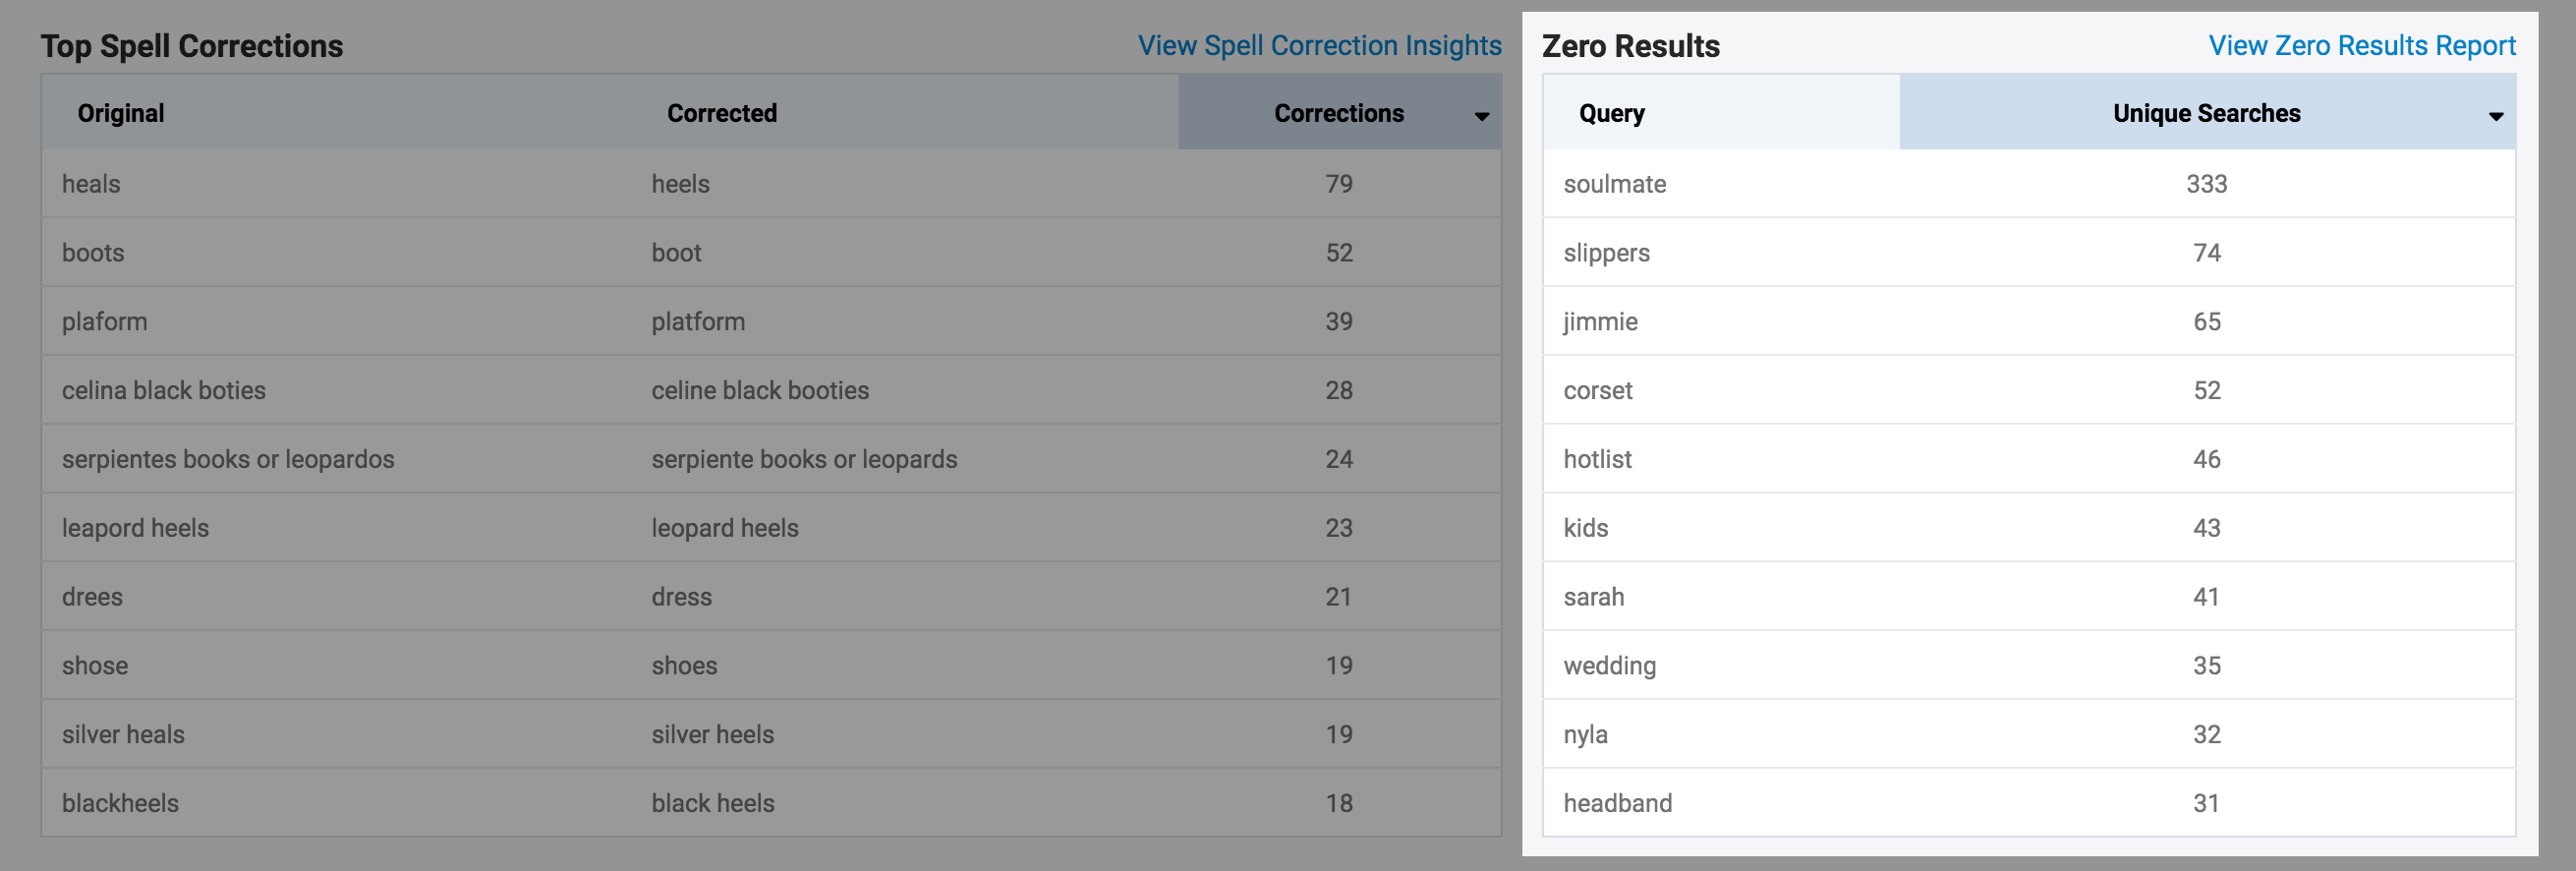
Zero Results
The Zero Results report gives you a comprehensive view into the instances where someone searches for something on your store and no products are found.
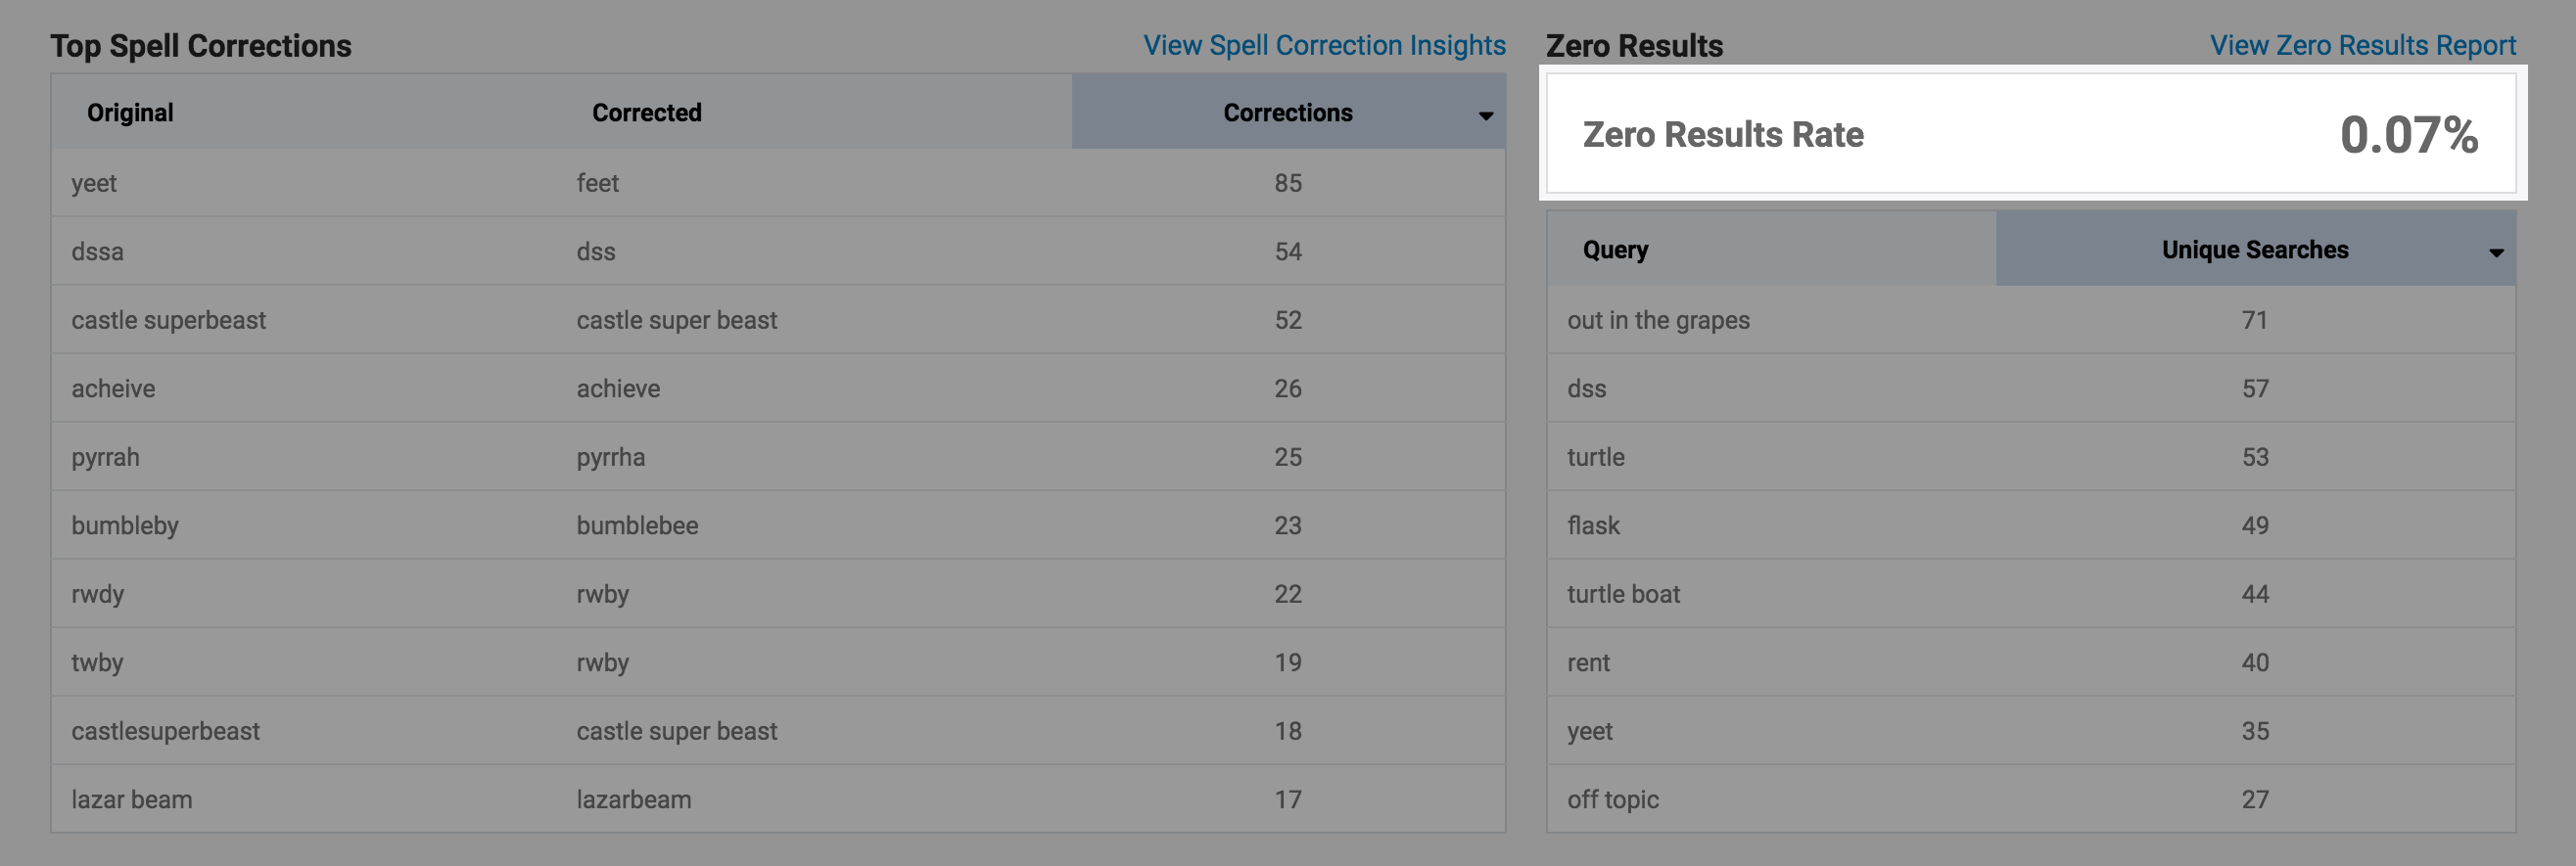
Zero Results Rate
Highlights the percentage of the searches that resulted in zero results overall.
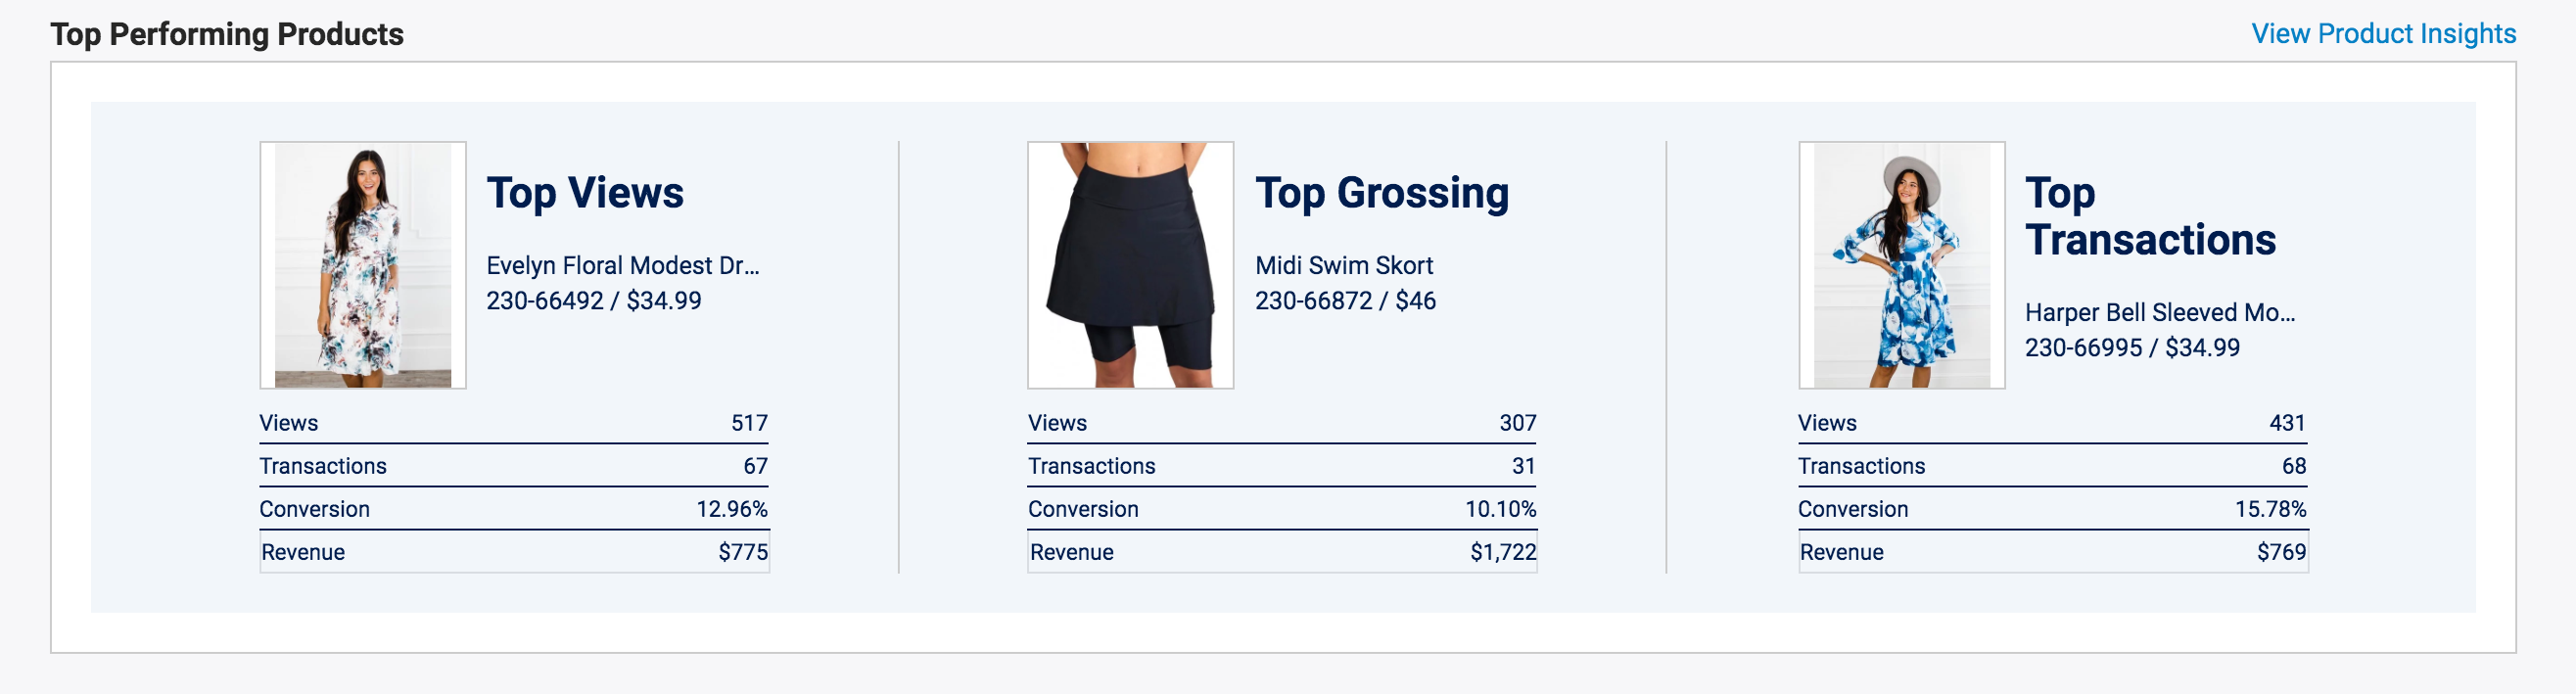
Top Performing Products
Product Insights brings to light both high level and granular views of how your products are performing. With this powerful tool, you’ll gain visibility into product performance, how shoppers interact with your products, and suggested action steps to further optimize performance.
NOTE: For performance reasons, we are only ever returning 7 days for this.
Comments
0 comments
Article is closed for comments.